Declining ROAS Troubleshooting: Step-by-Step Recovery Guide
Few things cause more anxiety for digital marketers than watching a profitable campaign's Return on Ad Spend steadily decline. What was once a reliable performer now threatens to become a money pit. The difference between businesses that recover quickly and those that spiral into unprofitability often comes down to having a systematic recovery framework.
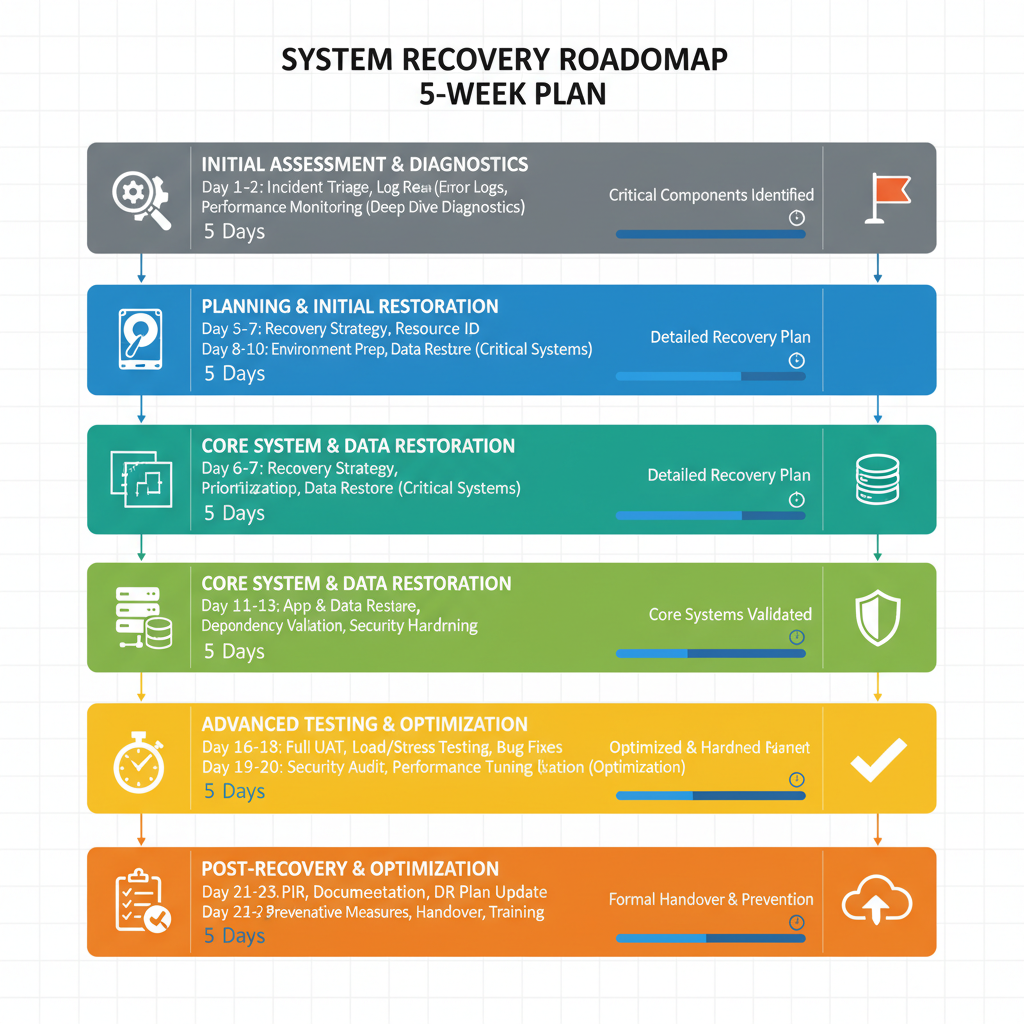
This comprehensive guide provides a week-by-week roadmap for diagnosing and recovering from declining ROAS. You'll learn exactly what to check, when to make changes, and how to implement a systematic testing approach that identifies solutions without making problems worse.
Why ROAS Declines and How to Fix It Fast
ROAS rarely drops overnight unless something breaks. More commonly, it degrades gradually over weeks—a slow decline that's easy to ignore until it becomes a crisis. Understanding the typical causes helps you respond appropriately.
The Primary Causes of ROAS Decline1. Creative fatigue (40% of cases): Audiences have seen your ads too many times
2. Audience saturation (25% of cases): You've exhausted your best prospects
3. Increased competition (15% of cases): Market dynamics shifting against you
4. Conversion rate degradation (10% of cases): Website or checkout problems
5. Platform algorithm changes (5% of cases): Platform optimization updates
6. External market factors (5% of cases): Seasonality, economic shifts, industry changes
The first two causes—creative fatigue and audience saturation—account for 65% of ROAS declines and are within your direct control to fix. This guide prioritizes solutions for the most common problems while providing frameworks for addressing less frequent causes.
Fast vs. Slow Decline PatternsThe speed of decline indicates probable cause:
Sudden drops (>30% decline in <1 week):- Tracking breakage or technical issues
- Platform policy violations or restrictions
- Major competitor action or market shift
- Significant platform algorithm change
- Broken landing pages or website issues
- Creative fatigue setting in
- Audience saturation developing
- Seasonal trend shifts
- Competitive pressure increasing
- Market maturation
- Audience quality dilution from expansion
- Product-market fit shifts
- Brand positioning changes needed
Sudden drops demand immediate investigation of technical factors. Gradual declines suggest creative and audience refresh needs. Slow degradation indicates strategic adjustments rather than tactical fixes.
Use our ROAS Calculator to track your performance trends and identify decline patterns early. For systematic diagnosis of the root cause, see our Low ROAS Diagnosis Guide.
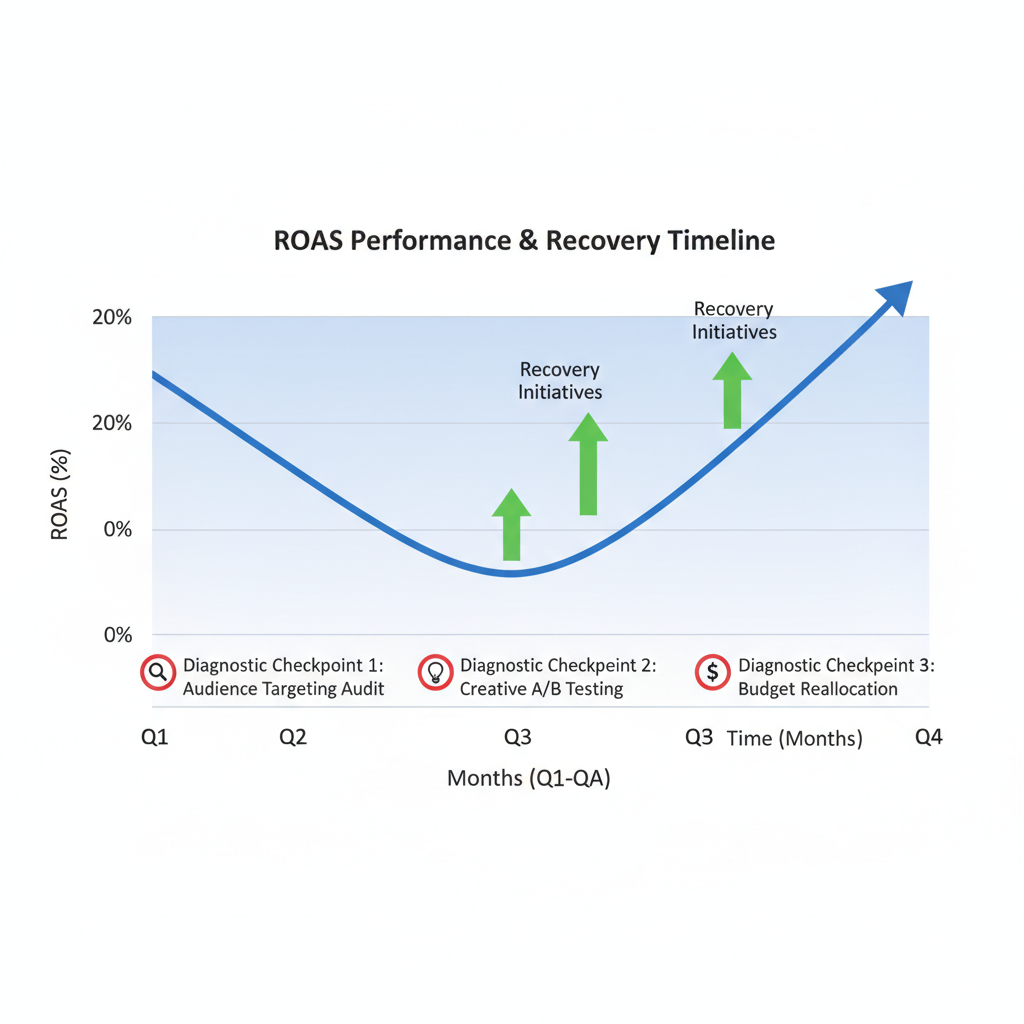
Week 1: Immediate Diagnostic Steps
When you notice ROAS declining, the first week focuses on gathering data and identifying root causes. Avoid making reactive changes before you understand what's actually wrong.
Day 1: Data CollectionPull comprehensive performance data for the last 60-90 days:
Campaign metrics to export:- Impressions, reach, frequency
- Clicks, CTR
- CPM, CPC
- Conversions, CVR
- Spend, revenue, ROAS
- Add-to-cart rate, checkout initiation rate
- Landing page views, bounce rate
- Individual campaigns and ad sets
- Creative/ad level
- Audience segments
- Device type (mobile vs. desktop)
- Placement (feed, stories, search, shopping, etc.)
- Time periods (week-over-week, month-over-month)
- Last 30 days vs. previous 30 days
- Current month vs. same month last year
- Current week vs. average of last 4 weeks
This creates your diagnostic baseline. You're looking for which metrics changed and when.
Day 2: Metric AnalysisCreate a performance trend chart showing:
1. ROAS trend line (primary metric)
2. CPM trend line (cost efficiency)
3. CTR trend line (creative effectiveness)
4. CVR trend line (conversion efficiency)
5. Frequency trend line (saturation indicator)
Overlay these metrics on a single time-series chart. The relationships between these trends reveal the root cause:
- ROAS declining + CPM rising + Frequency rising = Audience saturation/creative fatigue
- ROAS declining + CTR declining + Frequency rising = Creative fatigue
- ROAS declining + CVR declining + CTR stable = Landing page or offer problem
- ROAS declining + CPM rising + CTR stable = Increased competition or seasonal CPM increase
- All metrics declining simultaneously = Major external factor or tracking issue
Before assuming performance problems, verify your tracking is accurate:
Tracking verification checklist:- [ ] Pixel/tag firing correctly on all pages
- [ ] Test conversions appearing in platform within expected time
- [ ] No recent website changes that could affect tracking
- [ ] Server-side events (if applicable) still functioning
- [ ] No browser update issues (Safari ITP, Chrome changes)
- [ ] Attribution windows unchanged
- [ ] iOS 14.5+ tracking issues resolved
Test by manually completing a conversion and verifying it appears in your ads platform within 15 minutes.
Common technical issues:- Tag manager changes removing tracking codes
- Website platform updates breaking pixel implementation
- GDPR/privacy changes affecting cookie functionality
- Server-side tracking disconnections
- Incorrect conversion event mapping
If you find tracking issues, fix immediately and wait 3-7 days to collect accurate data before making campaign changes.
Day 4: Creative AuditAnalyze your creative performance systematically:
Creative age analysis:- How long has current creative been running?
- What was the ROAS in weeks 1, 2, 3, 4+ of each creative?
- When did performance peak and start declining?
- Week 1: Learning and optimization (volatile ROAS)
- Week 2-3: Peak performance (highest ROAS)
- Week 4-6: Gradual decline (fatigue setting in)
- Week 7+: Significant degradation (refresh needed)
Check frequency at the ad level. Creatives with frequency >3.0 on Meta or equivalent metrics on other platforms are likely fatigued.
Engagement rate trends:Declining engagement (likes, comments, shares, saves) indicates creative fatigue even if CTR hasn't dropped yet.
Day 5: Audience AnalysisExamine audience performance and saturation:
Audience size vs. reach: Saturation levels: Saturation levels:- <25%: Healthy, plenty of fresh reach available
- 25-40%: Moderate, consider expansion
- 40-60%: High, expansion needed soon
- >60%: Saturated, immediate expansion critical
- Overlapping ad sets competing in the same auctions
- Percentage of overlap between audiences
- Lookalike audiences (1%, 3%, 5%, 10%)
- Interest-based segments
- Custom audiences from different sources
- Broad vs. specific targeting
- Use Meta Ad Library or similar tools to review competitor creative
- Check if competitors have launched major promotions
- Monitor competitor social media and website activity
- Review industry news for major market changes
- Compare current performance to same period last year
- Identify seasonal patterns in your historical data
- Check industry reports for seasonal CPM trends
- Review economic indicators affecting your market
- Review recent platform algorithm updates
- Check for policy changes affecting your ads
- Monitor platform status pages for known issues
- Review platform best practice documentation
- What metric declined most significantly?
- When did the decline begin?
- Is this a technical, creative, audience, or external issue?
- What is the most likely root cause?
Week 2: Testing and Validation
- Likelihood (based on data)
- Impact potential (how much could it move ROAS)
- Implementation difficulty (easy vs. hard)
- Test duration (quick vs. slow to learn)
- Create 3-5 new creative variations
- Test new angles, formats, or messaging
- Allocate 20-30% of budget to test
- Run for 7 days minimum
- Compare ROAS, CTR, frequency vs. existing creative
- Build 2-3 new audience segments
- Start with small budgets ($20-50/day)
- Run parallel to existing audiences
- Compare ROAS, CPM, quality of conversions
- Scale winners, pause losers after 5-7 days
- Create variant landing page or optimize existing
- Split traffic 50/50
- Test for statistical significance (>100 conversions per variant)
- Measure: Bounce rate, time on page, CVR, ROAS
- Test alternative bidding strategies:
- Run duplicated campaigns with different strategies
- Compare efficiency after learning phase
- Change ONE variable per test
- Run long enough for statistical significance
- Document results systematically
- Avoid making multiple changes simultaneously
- Is any test showing improved ROAS?
- Which hypothesis appears validated?
- Are there unexpected learnings?
- What needs more time vs. clear winner/loser?
- ROAS improvement >20% with statistical confidence
- Consistent day-over-day improvement
- Leading indicators (CTR, CVR) improve significantly
- ROAS >30% worse than control
- Clearly harmful metrics (very high frequency, poor engagement)
- Breaking even at best with no improvement trend
- Results inconclusive but showing promise
- Need more data for statistical significance
- Metrics improving but slowly
Creative Refresh Strategy
Creative fatigue is the leading cause of ROAS decline. A systematic creative refresh strategy prevents problems before they start. The Creative Lifecycle Management System Implement this ongoing framework: Phase 1: Creation (Week 0) Develop creative in batches of 3-5 variations:- 1-2 proven concepts (variations of winners)
- 2-3 new angles or approaches (testing)
- Mix formats (static, video, carousel, UGC)
- Launch all variations simultaneously
- Equal initial budgets for fair testing
- Monitor daily performance
- Identify early winners by day 3-5
- Reallocate budget to top performers
- Pause clear losers
- Maintain 2-3 active creatives minimum
- Increase budgets on validated winners
- Monitor frequency closely
- Prepare next creative batch
- Launch new creative before fatigue sets in
- Gradually transition budget to fresh creative
- Retire fatigued creative at frequency >4.0
- 3 active creatives running simultaneously at any time
- 2 new creatives launched every 14 days
- 1 winner from each batch scaled aggressively
- [ ] New visual elements (images, video footage)
- [ ] Different hooks (first 3 seconds of video, headline)
- [ ] Alternative value propositions
- [ ] Different social proof elements
- [ ] New formats (static to video, video to carousel)
- [ ] User-generated content vs. branded content
- [ ] Different calls-to-action
- [ ] Seasonal or timely angles
- What do your top 3 performing creatives have in common?
- Which visual elements appear in winners?
- What messaging angles drive best performance?
- Which formats consistently outperform?
- Winning pattern: UGC-style videos with problem-solution narrative
- Variation 1: Same format, different problem angle
- Variation 2: Same narrative, different creator/actor
- Variation 3: Same message, carousel format instead of video
Audience Expansion or Contraction
Audience strategy directly impacts ROAS sustainability. Knowing when to expand, contract, or refresh audiences is critical. When to Expand Audiences Expand when you see:- Audience saturation >40%
- Frequency >3.5
- Reach plateau (not growing despite budget increases)
- CPM increasing while targeting remains constant
- Strong ROAS with room to scale spend
- Start with 1% lookalike of converters
- Expand to 2-3% when 1% saturates
- Test 5% and 10% for very large budgets
- Stack multiple sources (website visitors + purchasers + high-value customers)
- Add related interests to proven winners
- Layer interests for more specific targeting
- Test broad match keywords on Google
- Test adjacent markets
- Expand to lower-tier cities/regions
- Consider international expansion
- Expand age ranges by 5-10 years
- Test opposite gender (if relevant)
- Remove demographic restrictions for platforms with good automation
- Poor ROAS despite fresh creative and optimized landing pages
- Low-quality conversions (high return rate, low engagement)
- Declining repeat purchase rate from ad traffic
- Strong performance from subset of audience
- Age and gender
- Location
- Device type
- Placement
- Add interest layers to broad targeting
- Tighten lookalike percentages
- Use more specific keywords
- Implement negative keywords/interests
- People who clicked but never purchased (after 30 days)
- Converters with high return rates
- Low-value purchasers if focusing on LTV
- [ ] Update custom audiences with fresh data
- [ ] Rebuild lookalikes from recent converters (not stale data)
- [ ] Exclude recent purchasers from prospecting
- [ ] Add website visitors to retargeting pools
- [ ] Refresh engagement audiences (page likes, video views)
Budget and Bidding Adjustments
Strategic budget and bidding changes can recover ROAS without creative or audience changes. Budget Reallocation Strategy Weekly budget optimization process:Step Performance tiering
Categorize campaigns by ROAS:- Tier 1 (>6.0 ROAS): Scale-ready, increase budget 20-30%
- Tier 2 (4.0-6.0 ROAS): Maintain, optimize but don't scale yet
- Tier 3 (2.0-4.0 ROAS): Problem zone, reduce budget or test fixes
- Tier 4 (<2.0 ROAS): Pause or dramatically restructure
Step Gradual scaling rules
When increasing budgets:- Increase by maximum 20-30% per change
- Wait 3-5 days between increases
- Monitor for learning phase resets
- Scale more conservatively if ROAS starts declining
- Reduce 30-50% for underperformers
- Wait 2-3 days to see if performance stabilizes
- Pause entirely if no improvement after 2 reductions
Step Cross-campaign shifts
Move budget from weak to strong performers:- Calculate each campaign's revenue contribution
- Shift budget from bottom 25% to top 25%
- Maintain minimums for learning ($20/day Meta, $50/day Google)
- Meta: Move from Lowest Cost to Cost Cap or Bid Cap
- Google: Implement Target ROAS bidding
- Set initial targets at current performance, then increase gradually
- Increase cost caps by 15-20%
- Test Highest Volume bidding
- Expand audiences to increase available inventory
- Increase budget 20% every 3-5 days
- Monitor CPM and ROAS closely
- Use automated bidding for scale (Target ROAS)
- Extend attribution windows (7-day vs. 1-day)
- Increase budgets to exit learning phase faster
- Consider consolidating campaigns for more stable delivery
Expected daily spend = Monthly budget / Days in monthActual pace = Current spend / Days elapsedIf actual pace is >120% of expected, you'll exhaust budget early. If <80%, you're underdelivering.
Pacing solutions:
- Overdelivery: Reduce daily budgets, implement dayparting
- Underdelivery: Increase budgets, expand audiences, loosen bidding
Platform-Specific Recovery Tactics
Each advertising platform has unique characteristics requiring tailored approaches.
Meta (Facebook/Instagram) Recovery PlaybookPrimary levers for ROAS recovery:
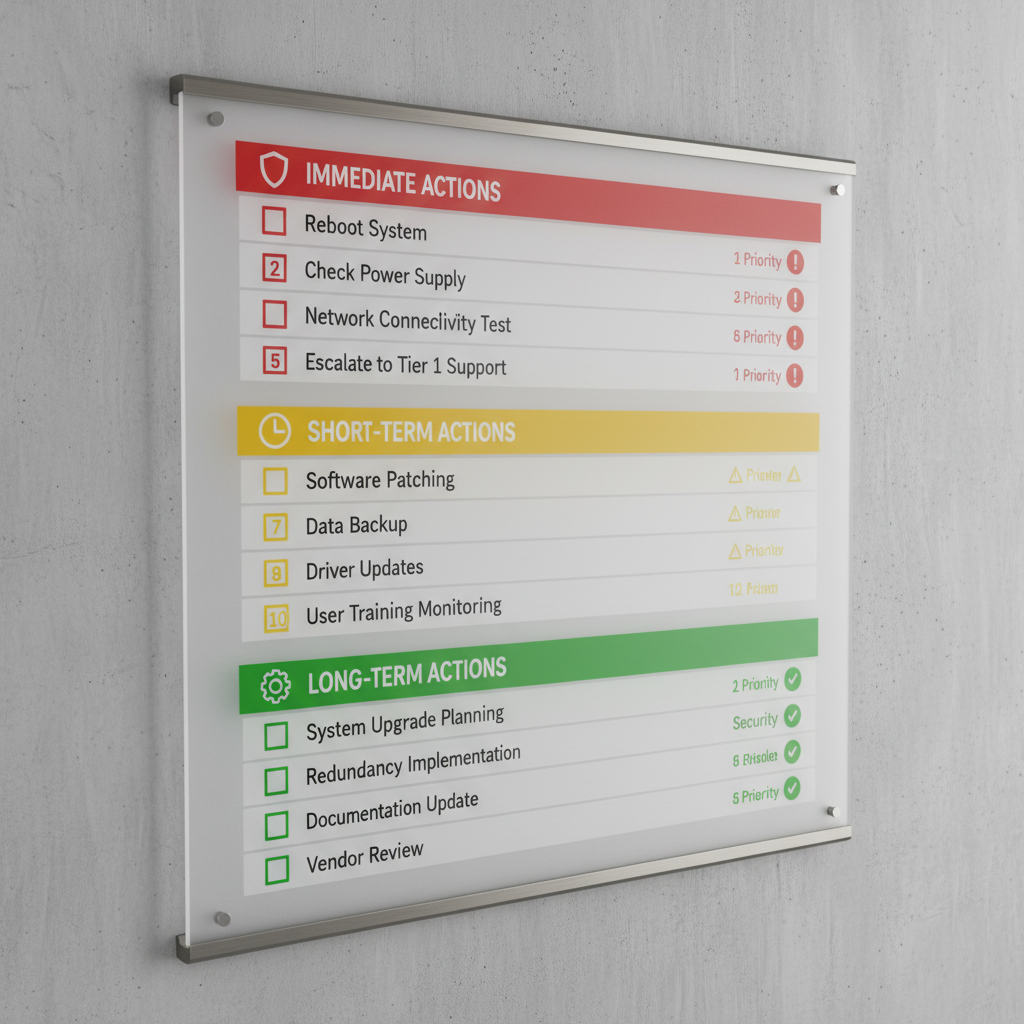
Immediate actions:- Check for account quality issues or policy violations
- Review creative frequency by ad
- Analyze placement performance (shift budget to winners)
- Test Advantage+ Shopping campaigns if available
- New creative formats (Reels vs. Stories vs. Feed)
- Broad targeting vs. detailed (often broad wins now)
- Dynamic creative testing with multiple variants
- Catalog sales campaigns vs. conversion campaigns
- Consolidation (fewer ad sets, higher budgets per ad set)
- Automated solutions (Advantage+ campaigns)
- Updated conversion events (optimize for purchase vs. add-to-cart)
- Retargeting refinement (engagement-based audiences)
- Learning phase stuck: Increase budgets or consolidate
- High frequency: Expand audiences or refresh creative
- Low delivery: Check auction overlap and audience size
- Disapproved ads: Review policy compliance
Primary levers for ROAS recovery:
Immediate actions:- Review Search Terms Report, add negative keywords
- Check Quality Scores, improve ad-to-landing page relevance
- Analyze device performance, adjust mobile bids
- Review shopping feed quality for ecommerce
- Responsive Search Ads with more variations
- Smart Shopping vs. Standard Shopping
- Audience layering on search campaigns
- Expanded keyword match types vs. exact match only
- Remarketing list expansion
- Dynamic Search Ads for coverage
- YouTube retargeting campaigns
- Customer Match audience development
- Low impression share: Increase bids or budgets
- Poor Quality Score: Improve landing page speed and relevance
- Wasted spend: Expand negative keyword lists
- Shopping feed issues: Optimize product titles and attributes
Primary levers for ROAS recovery:
Immediate actions:- Review video completion rates (optimize hooks)
- Check for native vs. overly produced content (native usually wins)
- Test spark ads from organic posts
- Analyze sound-on vs. sound-off performance
- UGC creators vs. branded content
- Trending sounds and formats
- Different video lengths (15s vs. 30s vs. 60s)
- Various calls-to-action
- Community engagement audiences
- Hashtag challenge participation
- Creator marketplace partnerships
- Cross-platform retargeting
Prevention: Maintaining Stable ROAS
The best ROAS recovery is preventing decline in the first place.
The ROAS Stability SystemImplement these ongoing practices:
Weekly monitoring:- Review ROAS by campaign (check for >15% week-over-week decline)
- Monitor frequency (refresh creative when approaching 3.0)
- Track CPM trends (investigate >20% increases)
- Analyze CTR (address >15% declines immediately)
- Launch new creative variations
- Test audience expansions
- Experiment with new platforms or placements
- Validate optimization hypotheses
- Comprehensive creative performance review
- Audience saturation analysis
- Budget reallocation based on ROAS
- Landing page and website performance review
- Competitive landscape assessment
- Platform update impacts
- Attribution model validation
- Customer LTV and CAC analysis
Create alert thresholds that trigger investigation:
- ROAS decline >10% for 3 consecutive days
- CPM increase >15% week-over-week
- Frequency >2.8 on any ad
- CTR decline >20% from baseline
- CVR decline >15% from baseline
- Learning phase >14 days
When alerts trigger, start diagnostic process immediately rather than waiting for major degradation.
When to Pause vs. Optimize
The hardest decision: when to pause campaigns vs. continue optimizing.
Pause campaigns when:- Fundamental unit economics broken: ROAS below break-even with no path to profitability
- Multiple optimization attempts failed: Tested creative refresh, audience expansion, bidding changes with no improvement
- Negative ROI for 14+ days: Losing money consistently with no signs of recovery
- Strategic shift needed: Product, offer, or market no longer viable for paid advertising
- Platform or policy issues: Ongoing restrictions preventing normal performance
- Recent decline: Performance dropped <30 days ago
- Clear diagnosis: Identified specific fixable cause (creative fatigue, saturation)
- Historical strong performance: Campaign was profitable within last 60 days
- Tests showing promise: Experiments demonstrating improvement potential
- Seasonal factors: Temporary market conditions expected to normalize
Give optimization efforts a fair chance with structure:
- Days 1-14: Aggressive testing and fixes
- Days 15-21: Evaluate test results, implement winners
- Days 22-30: Monitor recovery or continued decline
At day 30:
- If ROAS improved >20%: Continue and scale
- If ROAS improved 10-20%: Continue with cautious optimism
- If ROAS improved <10%: Consider pause or major restructure
- If ROAS continued declining: Pause campaign
This prevents both premature pausing of fixable campaigns and endless optimization of broken strategies.
Building Resilient Campaigns
Long-term ROAS stability comes from systematic campaign construction.
The Resilient Campaign ArchitectureBuild campaigns that resist degradation:
Creative resilience:- Always have 3+ active creatives per campaign
- Systematic refresh schedule (every 2-3 weeks)
- Creative production pipeline (always have new assets ready)
- Performance pattern analysis (know what works and why)
- Layered targeting (multiple audience tiers from cold to warm)
- Expansion headroom (never saturate >60% of any audience)
- Continuous audience development (new lists, lookalikes, interests)
- Regular exclusion list updates (recent purchasers, low-quality segments)
- Performance-based reallocation (weekly shifts to winners)
- Reserve budget for testing (10-15% for experimentation)
- Seasonal planning (higher budgets during peak periods)
- Diversified portfolio (multiple campaigns, not single winner dependency)
- Multi-platform presence (don't depend on single channel)
- Native best practices by platform (optimize for each specifically)
- Regular platform education (stay current on updates)
- Alternative options ready (backup platforms if primary struggles)
- Structured testing calendar (planned experiments, not reactive)
- Documented learnings (institutional knowledge, not individual)
- Hypothesis-driven experimentation (test with purpose)
- Controlled test design (proper statistical approaches)
Schedule these activities for ongoing ROAS health:
Daily:- Budget pacing check
- Major metric review (spend, ROAS, obvious anomalies)
- Performance tier assignments
- Budget reallocations
- Creative frequency checks
- Test result reviews
- Creative refresh launches
- Audience expansion tests
- Landing page optimizations
- Comprehensive performance analysis
- Competitive research
- Strategic planning session
- Platform update reviews
- Full account audit
- Customer LTV and CAC analysis
- Attribution model validation
- Annual budget planning
This systematic approach prevents the reactive firefighting that characterizes struggling advertisers.
Declining ROAS is stressful but solvable. The week-by-week recovery framework in this guide provides the structure needed to diagnose root causes, test solutions systematically, and implement fixes that actually work. Whether you're dealing with creative fatigue, audience saturation, conversion problems, or external factors, you now have a proven roadmap for recovery.
The key difference between advertisers who recover quickly and those who spiral is simple: systematic diagnosis before reactive changes. Follow the framework, document your learnings, and build the institutional knowledge that makes each future problem easier to solve.
Remember that every campaign eventually faces ROAS decline. Market conditions change, audiences evolve, and creative fatigues. The goal isn't preventing all decline—it's catching it early, diagnosing accurately, and recovering systematically. Build the processes in this guide into your ongoing operations, and ROAS declines transform from existential crises into manageable optimization opportunities.
Start with week 1 diagnostics, proceed methodically through testing and implementation, and commit to the prevention strategies that keep your campaigns resilient. Your future self—the one enjoying stable, profitable ROAS month after month—will thank you for the discipline you implement today.