Low ROAS Diagnosis: Is It High CPM, Low Conversion or Creative Fatigue?

When your Return on Ad Spend (ROAS) drops below target, the natural impulse is to panic and make immediate changes. But treating the symptoms without diagnosing the root cause often makes things worse. A systematic diagnostic approach separates profitable fixes from expensive mistakes.
This comprehensive guide provides a proven framework for diagnosing exactly why your ROAS is underperforming and prescribes specific solutions for each root cause. Whether you're dealing with rising costs, falling conversions, or creative exhaustion, you'll leave with a clear action plan.
The ROAS Diagnostic Framework
ROAS is determined by the relationship between three core metrics:
Breaking this down further:ROAS = (Orders × AOV) / (Impressions × CPM / 1000)ROAS = (Traffic × Conversion Rate × AOV) / Ad SpendROAS = (Orders × AOV) / (Impressions × CPM / 1000)ROAS = (Traffic × Conversion Rate × AOV) / Ad SpendThis reveals the three primary drivers of ROAS performance:
1. Cost efficiency (CPM, CPC, how much you pay for traffic)
2. Conversion efficiency (CTR, landing page conversion rate, how well traffic converts)
3. Creative effectiveness (engagement, relevance, ad fatigue)
Low ROAS always stems from problems in one or more of these areas. The diagnostic process identifies which specific factor is responsible.
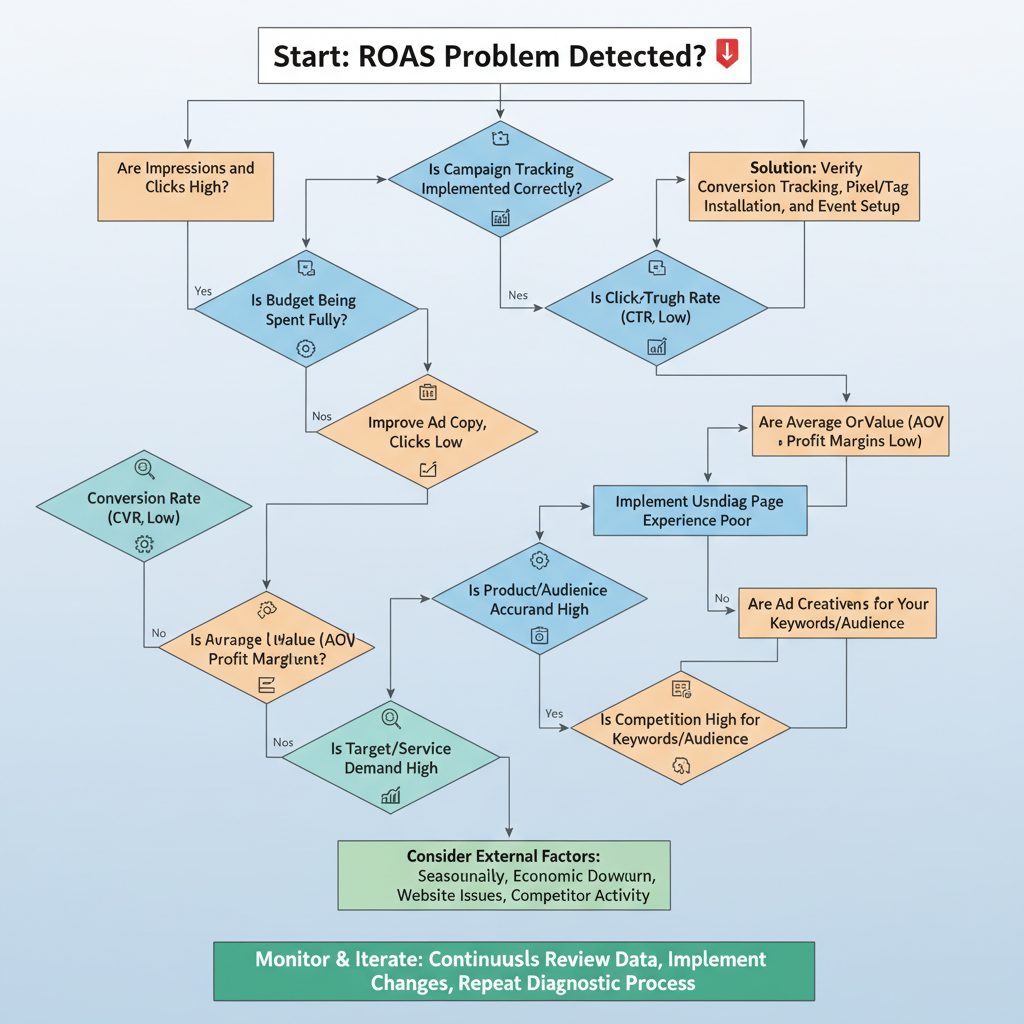
The Diagnostic HierarchyFollow this sequence to isolate the root cause:
1. Check for sudden vs. gradual decline (determines urgency and likely cause)
2. Analyze cost metrics (CPM, CPC trends)
3. Examine conversion metrics (CTR, CVR, landing page performance)
4. Evaluate creative performance (frequency, engagement, fatigue signals)
5. Review external factors (seasonality, competition, platform changes)
Most ROAS problems announce themselves clearly when you know which metrics to examine and how to interpret the patterns.
Use our ROAS Calculator to track your performance trends over time and compare them against industry standards in our Advertising Benchmarks.
Identifying High CPM as the Root Cause
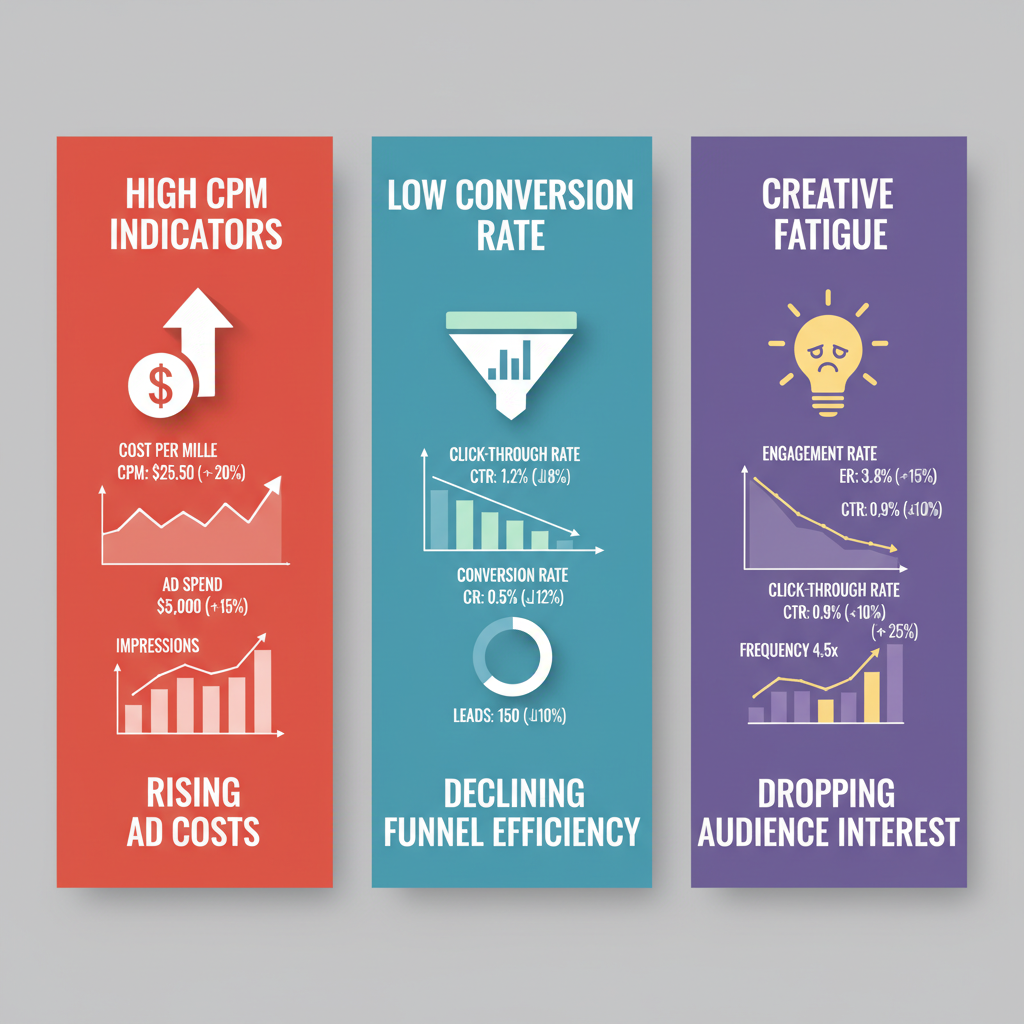
High CPM (Cost Per Thousand Impressions) directly increases your advertising costs without any guarantee of improved results. When CPM rises but conversion rates remain stable, you're simply paying more for the same outcomes.
High CPM Diagnostic SignalsYou have a CPM problem when you observe:
- CPM increase of 20%+ month-over-month while other metrics remain stable
- CPM significantly above platform benchmarks for your industry and targeting
- Declining reach despite stable or increased budgets
- Auction overlap warnings indicating you're competing against yourself
- Stable CTR and CVR but declining ROAS
Check your CPM against these 2025 benchmarks:
Meta (Facebook/Instagram):- Broad targeting: $8-15 CPM
- Interest targeting: $12-20 CPM
- Lookalike audiences: $10-18 CPM
- Retargeting: $15-30 CPM
- Broad targeting: $2-5 CPM
- Contextual targeting: $4-8 CPM
- Remarketing: $6-12 CPM
- Broad targeting: $6-10 CPM
- Interest targeting: $8-15 CPM
- Retargeting: $12-20 CPM
If your CPMs exceed these ranges by 50% or more, cost efficiency is likely your primary problem.
Common High CPM Causes- Audience saturation: Reaching the same people repeatedly, driving up costs
- Increased competition: More advertisers targeting the same audience
- Seasonal demand: Holiday periods, industry events, tax season
- Narrow targeting: Overly specific audience criteria limiting inventory
- Poor relevance scores: Low engagement causing platform to charge more
- Budget too low: Insufficient spend to win auctions efficiently
- Expand audience targeting to increase available inventory
- Review frequency (>3 suggests saturation; expand reach)
- Refresh creative to improve relevance scores
- Test different dayparting to avoid peak competition hours
- Increase budgets if they're below platform minimums ($20+/day on Meta, $50+/day on Google)
- Build lookalike audiences from your best converters
- Test new platforms with less competition
- Implement geographic expansion
- Develop creative variants to reduce frequency
- Consider alternative bidding strategies (lowest cost vs. cost cap)
- Build organic social audiences to reduce cold traffic dependence
- Invest in SEO to decrease paid traffic requirements
- Create content that earns organic reach
- Develop retention programs to maximize customer LTV
Use our CPM Calculator to determine if your costs are competitive, and when CPMs are consistently high, evaluate whether switching platforms could improve efficiency with our Platform Comparison Tool.
Spotting Conversion Rate Issues
When CPM remains stable but ROAS declines, your conversion funnel is the culprit. Traffic costs the same, but fewer people are converting.
Conversion Problem Diagnostic SignalsYou have a conversion issue when you observe:
- Declining Click-Through Rate (CTR) on ads (traffic quality or ad relevance problem)
- Falling landing page conversion rate (CVR) (website or offer problem)
- Increasing Cost Per Click (CPC) despite stable CPM (lower CTR drives higher CPC)
- Stable add-to-cart rate but declining purchase rate (checkout friction)
- Lower Average Order Value (AOV) (product mix or pricing issues)
Analyze each stage separately:
Stage 1: Ad Click-Through RateHealthy CTR benchmarks:
- Meta feed ads: 1.5-3.0%
- Meta Stories: 0.8-2.0%
- Google Search: 4.0-8.0%
- Google Shopping: 0.5-1.5%
- TikTok: 1.5-3.5%
If CTR falls below these ranges, your ads aren't resonating with the audience seeing them.
CTR Problem Solutions:- Test new ad copy focusing on benefits not features
- Refresh visual creative (images/videos)
- Sharpen targeting to reach more qualified audiences
- Test different ad formats
- Improve headline relevance to search intent (Google)
Healthy landing page CVR benchmarks:
- Cold traffic: 1.5-3.5%
- Warm traffic: 3.0-6.0%
- Retargeting: 5.0-10.0%
If CVR is declining while traffic quality remains consistent, your website is the problem.
CVR Problem Solutions:- Conduct landing page speed audit (target <3 seconds)
- Review mobile experience (60-80% of traffic is mobile)
- Simplify checkout process (reduce required fields)
- Add trust signals (reviews, guarantees, security badges)
- Test different offers and value propositions
- Implement exit-intent popups for abandonment
- A/B test key page elements
Declining AOV often reflects product mix shifts or competitive pricing pressure.
AOV Problem Solutions:- Implement upsell offers at checkout
- Create product bundles
- Set minimum thresholds for free shipping
- Test price points and promotional strategies
- Analyze which products drive highest value orders
- Personalize product recommendations
A common conversion problem is the shift in traffic toward mobile without corresponding mobile optimization:
Check your mobile vs. desktop conversion rate ratio:
Healthy: Mobile CVR = 60-80% of Desktop CVR- Problem: Mobile CVR = <50% of Desktop CVR
If mobile conversion lags significantly, prioritize mobile UX improvements immediately.
Detecting Creative Fatigue Signals
Creative fatigue occurs when your audience has seen your ads too many times and stops engaging. Unlike CPM or conversion problems, creative fatigue is a time-based degradation.
Creative Fatigue Diagnostic SignalsYou have creative fatigue when you observe:
- Gradual CTR decline over 2-4 weeks despite stable CPM
- Average frequency >3.0 on Meta campaigns
- Declining engagement rates (likes, comments, shares)
- Increasing negative feedback (hide ad, report ad actions)
- Stable or increasing CPM with declining performance (audience learns to ignore ads)
- Strong initial performance that deteriorates over time
Frequency (average times each person sees your ad) is the primary creative fatigue indicator:
- Frequency 1.0-2.0: Healthy, building awareness
- Frequency 2.0-3.0: Monitor closely, prepare refresh
- Frequency 3.0-5.0: Fatigue setting in, refresh needed
- Frequency >5.0: Severe fatigue, immediate creative rotation required
Different campaign types tolerate different frequencies:
- Prospecting (cold traffic): Rotate at 2.5-3.0 frequency
- Retargeting: Rotate at 4.0-5.0 frequency (warm audiences tolerate more)
- Brand campaigns: Rotate at 3.0-4.0 frequency
- Pause fatigued creative
- Launch existing creative variants
- Increase audience size to reduce frequency
- Reduce budget to slow frequency accumulation
- Create 3-5 variations of top performers
- Test different formats (static vs. video vs. carousel)
- Develop creative testing calendar (refresh every 2-3 weeks)
- Implement systematic creative rotation
- Use Dynamic Creative Testing (DCT) on Meta
- Build in-house or agency creative production capacity
- Develop creative templates for rapid production
- Create user-generated content (UGC) pipelines
- Establish creative testing framework
- Analyze winning creative patterns for systematic replication
Maintain creative freshness with this systematic approach:
- 3 campaign types: Prospecting, retargeting, retention
- 3 creative angles per campaign: Problem-solution, social proof, transformation
- 3 variations per angle: Different visuals, copy, formats
This generates 27 creative assets, allowing systematic rotation before fatigue sets in.
Multi-Factor ROAS Problems
Real-world ROAS problems often involve multiple simultaneous issues. The diagnostic process isolates which factor is primary and which are secondary.
Combined Problem Patterns Pattern 1: Rising CPM + Creative FatigueSymptoms: Increasing CPM (20-40%), declining CTR (30-50%), high frequency (>4.0)
Diagnosis: Creative fatigue is driving poor relevance scores, causing CPM increases
Solution Priority:
- Refresh creative immediately (addresses both issues)
- Expand audiences (reduces frequency, provides fresh reach)
- Increase budgets once creative and audiences are refreshed
Symptoms: Above-benchmark CPM, below-benchmark CVR, stable CTR
Diagnosis: You're paying too much for traffic that doesn't convert well
Solution Priority:
- Tighten targeting to more qualified audiences (may increase CPM but improve CVR)
- Improve landing page conversion rate
- Test lower-funnel campaign objectives (conversions vs. traffic)
Symptoms: High frequency, declining CTR and CVR simultaneously
Diagnosis: Fatigued creative is attracting lower-quality clicks
Solution Priority:
- Refresh creative with stronger value propositions
- Audit landing page for alignment with new creative
- Expand or refine audiences based on learning
Symptoms: CPM spike (>50%), frequency increase, general performance decline
Diagnosis: Holiday or seasonal period with increased competition hitting fatigued campaigns
Solution Priority:
- Increase budgets to compete in season (if profitable)
- Refresh creative with seasonal angles
- Focus on retargeting and lower-funnel tactics
- Accept temporary efficiency decline if customer LTV justifies it
Use this flowchart to isolate primary issues:
- Has CPM increased >20%?
- Has CTR declined >20%?
- Has landing page CVR declined >15%?
- All metrics stable but ROAS declining?
- YES: Is frequency >3.0?
- YES: Creative fatigue causing CPM rise
- NO: Check competition/seasonality
- NO: Go to step 2
- YES: Is frequency >3.0?
- YES: Creative fatigue
- NO: Ad creative or audience mismatch
- NO: Go to step 3
- YES: Website/offer problem
- NO: Check external factors
- Possible AOV decrease or attribution issues
This systematic evaluation prevents misdiagnosing symptoms as root causes.
Platform-Specific Diagnostic Checklists
Different platforms have unique characteristics that affect diagnostic approaches.
Meta (Facebook/Instagram) Diagnostic ChecklistProblem indicators:
- Frequency >3.0
- Relevance score <6 (1-10 scale)
- CPM >$20 for standard targeting
- Auction overlap >20%
Platform-specific checks:
- Review Account Quality score
- Check for any policy restrictions
- Analyze placement performance (Feed vs. Stories vs. Reels)
- Examine audience overlap between ad sets
- Review learning phase status (stable vs. relearning)
Meta-specific solutions:
- Consolidate overlapping audiences
- Use Advantage+ Shopping Campaigns for automation
- Leverage Catalog Sales for dynamic retargeting
- Test Reels placement for lower CPMs
Problem indicators:
- Quality Score <7 (1-10 scale)
- Search impression share <50%
- CPM >$10 for Display campaigns
- Shopping CTR <1.0%
Platform-specific checks:
- Review Quality Score components (landing page, ad relevance, expected CTR)
- Check search term reports for irrelevant queries
- Analyze auction insights for competition
- Review device performance (mobile vs. desktop vs. tablet)
- Examine hour-of-day and day-of-week patterns
Google-specific solutions:
- Add negative keywords systematically
- Improve ad-to-landing page relevance
- Test Responsive Search Ads with more variations
- Use Smart Shopping for automated optimization
- Implement audience layering for better targeting
Problem indicators:
- CPM >$15
- Video completion rate <25%
- CTR <1.5%
Platform-specific checks:
- Analyze video hook (first 3 seconds)
- Review sound-on vs. sound-off performance
- Check native vs. polished content performance
- Examine for-you-page vs. following feed delivery
TikTok-specific solutions:
- Create more native, UGC-style content
- Test spark ads from organic posts
- Develop stronger pattern interrupts in first 2 seconds
- Use trending sounds and formats
- Test creator partnerships
Use our CPA Calculator to determine if your cost per acquisition aligns with your business model across different platforms.
Step-by-Step Troubleshooting Flowchart
Follow this systematic troubleshooting process:
Week 1: Data CollectionDay 1-2:
- Export last 30 days of campaign data
- Calculate CPM, CTR, CVR, ROAS by campaign
- Identify which campaigns are underperforming
Day 3-4:
- Compare current metrics to historical baselines
- Identify which metric changed most significantly
- Review frequency and creative age
Day 5-7:
- Audit landing pages and website
- Check for technical issues
- Analyze customer feedback and reviews
Day 8-9:
- Apply diagnostic framework from this guide
- Identify primary and secondary issues
- Develop hypothesis for root cause
Day 10-11:
- Research platform-specific factors
- Analyze competitive landscape
- Review external/seasonal factors
Day 12-14:
- Create prioritized list of issues
- Develop specific solutions for each
- Plan testing roadmap
Day 15-21:
- Implement highest-priority fixes
- Launch new creative if needed
- Adjust targeting/audiences
- Optimize landing pages
Day 22-28:
- Monitor results daily
- Collect data on changes
- Prepare to iterate based on learnings
Creating Your ROAS Recovery Action Plan
Transform diagnosis into action with this structured planning template:
Immediate Actions (Days 1-7)Priority 1 (Do first):
- [ ] Pause campaigns with ROAS <50% of target
- [ ] Refresh creative for campaigns with frequency >3.5
- [ ] Fix any broken tracking or technical issues
Priority 2 (Do next):
- [ ] Expand audiences for saturated campaigns
- [ ] Launch new creative tests
- [ ] Adjust budgets based on efficiency
- [ ] Systematic A/B testing of hypotheses
- [ ] Landing page optimization implementation
- [ ] New audience development
- [ ] Creative production ramp-up
- [ ] Build creative testing calendar
- [ ] Develop systematic refresh process
- [ ] Create performance monitoring dashboard
- [ ] Establish efficiency benchmarks and alerts
Define what success looks like:
- Target ROAS: _____
- Acceptable CPM range: $_____-$_____
- Target CTR: _____%
- Target CVR: _____%
- Maximum frequency: _____
Monitor these weekly and adjust tactics when metrics drift from targets.
Low ROAS is frustrating but rarely mysterious. The systematic diagnostic approach in this guide transforms vague performance problems into specific, actionable insights. Whether you're battling high CPMs, struggling with conversions, or fighting creative fatigue, you now have a proven framework for identifying root causes and implementing effective solutions.
The key is resisting the urge to make random changes. Diagnosis before treatment. Data before assumptions. Systematic analysis before reactionary tactics. Follow this approach, and you'll not only recover from ROAS declines but build the diagnostic skills to prevent them in the future.
Remember: every ROAS problem is an opportunity to understand your advertising system more deeply. The brands that scale profitably are those that treat problems as learning opportunities, systematically diagnose root causes, and implement data-driven solutions. Start with the diagnostic framework, follow the platform-specific checklists, and execute your recovery plan with disciplined consistency.