Retargeting ROI Calculator: How to Measure ROAS for Retargeting Campaigns

Retargeting campaigns operate in a fundamentally different environment than cold traffic campaigns. While prospecting ads aim to capture attention from users who've never heard of your brand, retargeting focuses on re-engaging warm audiences who already know you. This critical distinction means your ROI calculation approach must differ significantly.
Most marketers make a costly mistake: they use the same ROAS benchmarks and calculation methods for both cold and warm traffic. This approach leads to either overspending on underperforming retargeting campaigns or prematurely killing profitable ones. Understanding how to accurately calculate and interpret retargeting ROI isn't just a nice-to-have skill—it's the difference between scaling profitably and burning through your budget.
In this comprehensive guide, you'll learn exactly how to measure ROAS specifically for retargeting campaigns, understand industry benchmarks, avoid common calculation mistakes, and implement optimization strategies based on your actual performance data.
Understanding Retargeting ROI vs Standard ROAS
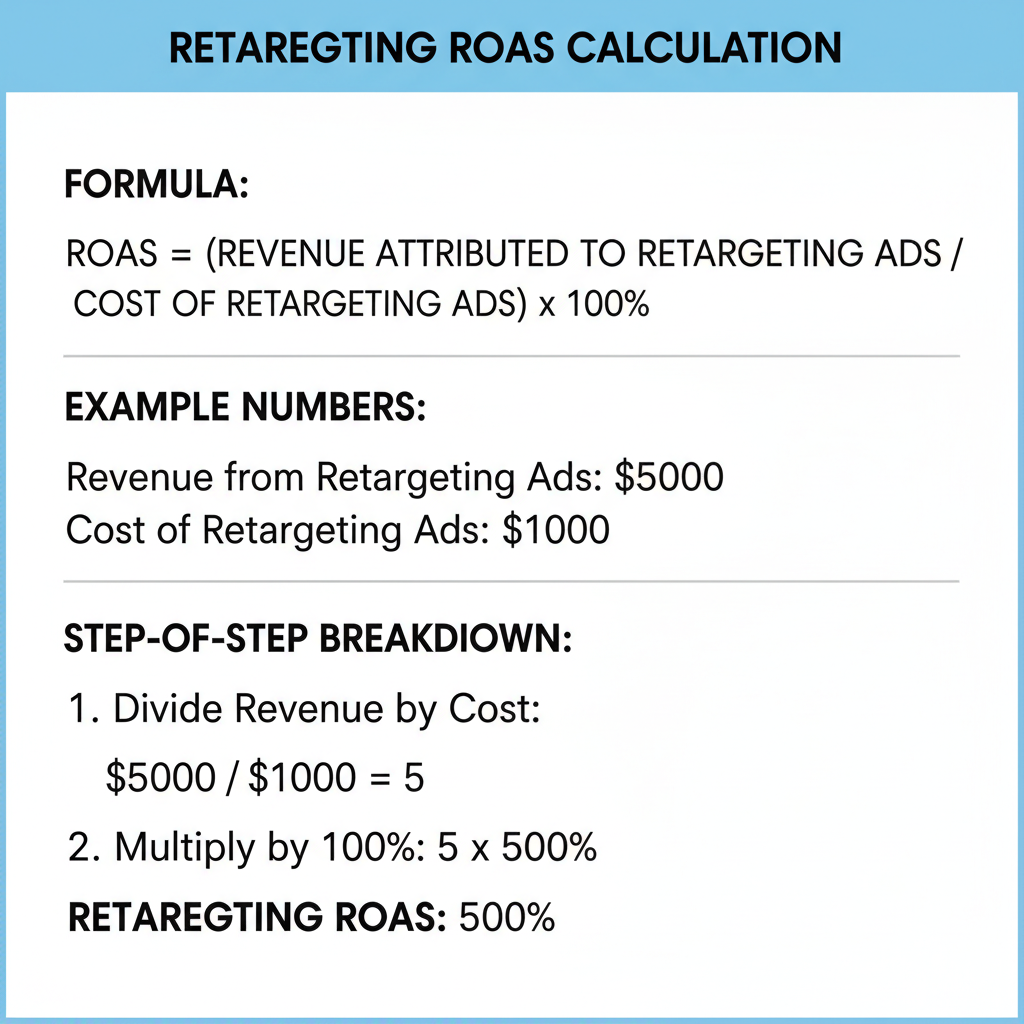
Return on Ad Spend (ROAS) measures how much revenue you generate for every dollar spent on advertising. The basic formula is simple:
ROAS = Revenue from Ads / Ad SpendHowever, retargeting ROAS requires additional considerations that standard ROAS calculations often miss.
Attribution Complexity: Retargeting campaigns rarely work in isolation. Users who see retargeting ads have already interacted with your brand through prospecting campaigns, organic search, social media, or other channels. Attributing 100% of the conversion value to retargeting alone inflates your apparent ROAS and creates misleading performance data. Incremental vs Total Revenue: The most critical distinction in retargeting ROI is understanding incremental revenue—the additional revenue generated specifically because of your retargeting ads. Some users in your retargeting audience would have converted anyway without seeing another ad. Your true retargeting ROAS should measure only the incremental lift, not total conversions from previously engaged users. Time Lag Considerations: Retargeting works on longer consideration cycles. A user might see your retargeting ad on Monday but not convert until Friday after seeing it three more times. Your attribution window settings dramatically affect reported ROAS. Too short, and you undercount conversions. Too long, and you overcredit retargeting for conversions driven by other factors. Cost Structure Differences: Retargeting typically has lower CPMs and CPCs than prospecting because you're targeting smaller, warmer audiences. This means your cost per impression and click should be significantly lower, but your overall reach is limited. A $5 CPM might be excellent for cold traffic but concerning for retargeting.The key insight: standard ROAS focuses on total return, while retargeting ROAS should focus on incremental return after accounting for baseline conversions.
Key Metrics for Retargeting Campaign Performance
Beyond basic ROAS, several metrics provide crucial context for retargeting performance:
View-Through Conversion Rate (VTCR): Measures conversions from users who saw but didn't click your retargeting ad, then later converted. This metric is particularly important for retargeting since awareness and consideration often don't require clicks. If your VTCR is high relative to click-through conversions, your ads are working even without direct clicks. Frequency: The average number of times each user sees your retargeting ad. Sweet spot frequency varies by industry and offer complexity, but generally falls between 3-7 impressions per user over a 7-day period. Below 3, you're not achieving sufficient reach. Above 10, you're likely experiencing diminishing returns and ad fatigue. Return Visit Rate: The percentage of retargeting ad recipients who return to your site within your attribution window. This leading indicator shows whether your ads are successfully driving consideration, even before conversion happens. Assisted Conversions: Conversions where retargeting played a role but wasn't the last click. In multi-touch attribution models, this shows retargeting's contribution to the overall conversion path. Often, retargeting assists far more conversions than it directly closes. Cost Per Return Visit: Total retargeting spend divided by the number of users who return to your site. This metric helps you understand efficiency before conversion happens. If this cost is rising while conversion rate stays stable, your retargeting is becoming less efficient at driving interest. Incremental Conversion Rate: The difference in conversion rates between users who see retargeting ads and a control group that doesn't. This is the gold standard metric but requires sophisticated holdout testing. If 5% of non-exposed users convert and 8% of exposed users convert, your incremental lift is 3 percentage points, or a 60% relative increase.When used together, these metrics paint a complete picture of retargeting performance beyond simple ROAS calculations. You can use our ROAS Calculator to quickly measure your base ROAS, then layer these additional metrics for full context.
Step-by-Step: Calculate Retargeting ROAS
Let's walk through calculating retargeting ROAS with real numbers, accounting for the complexities we've discussed.
Step Define Your Attribution Window
Choose an attribution window that matches your typical sales cycle. For e-commerce, 7-day click and 1-day view is common. For higher-ticket items or B2B, 28-day click and 7-day view might be more appropriate.
Example: We'll use 7-day click, 1-day view attribution.
Step Gather Your Raw Data
From your ad platform, collect:
- Total retargeting ad spend: $5,000
- Revenue attributed to retargeting: $35,000
- Retargeting-attributed conversions: 140
- Impressions delivered: 500,000
- Users reached: 50,000
Step Calculate Basic ROAS
Basic ROAS = $35,000 / $5,000 = 7.0x
This tells you that for every dollar spent, you generated $7 in tracked revenue. But this doesn't account for baseline conversions.
Step Estimate Baseline Conversions
Use historical data or a holdout test to estimate how many users would have converted without retargeting. Industry averages suggest 30-40% of retargeting conversions would have happened anyway.
Conservative estimate: 40% baseline
Baseline conversions: 140 × 0.40 = 56 conversions
Baseline revenue: $35,000 × 0.40 = $14,000
Step Calculate Incremental Revenue
Incremental revenue = Total attributed revenue - Baseline revenue
Incremental revenue = $35,000 - $14,000 = $21,000
Step Calculate True Retargeting ROAS
True Retargeting ROAS = Incremental Revenue / Ad Spend
True Retargeting ROAS = $21,000 / $5,000 = 4.2x
This more conservative figure accounts for users who would have converted regardless. Your true incremental return is 4.2x, not 7.0x.
Step Calculate Cost Per Incremental Conversion
Incremental conversions = 140 - 56 = 84
Cost per incremental conversion = $5,000 / 84 = $59.52
This shows the actual cost to generate each new conversion through retargeting.
This methodology provides a much more accurate picture of retargeting effectiveness. You can adapt our CPA Calculator to track cost per incremental conversion alongside your overall CPA.
Retargeting ROI Calculator Formula
Here's the complete formula framework for retargeting ROI calculation:
Basic ROAS Formula: Incremental ROAS Formula:Incremental ROAS = (Total Attributed Revenue × (1 - Baseline Conversion Rate)) / Total Ad SpendCPA_incremental = Total Ad Spend / (Total Conversions × (1 - Baseline Conversion Rate))ROI% = ((Incremental Revenue - Ad Spend) / Ad Spend) × 100Incremental Lift = (Exposed Group Conversion Rate - Control Group Conversion Rate) / Control Group Conversion Rate- Basic ROAS: 7.0x
- Incremental ROAS: 4.2x
ROI%: ((21,000 - 5,000) / 5,000) × 100 = 320%- Cost per incremental conversion: $59.52
- Ad Spend: Total amount spent on retargeting campaigns
- Attributed Revenue: All revenue within your attribution window
- Baseline Rate: Percentage of conversions that would occur without retargeting (30-50% typical)
- Attribution Window: Time period for counting conversions (7-day standard)
- View-Through Window: Time for counting view-through conversions (1-day typical)
Retargeting Revenue = Total Conversion Value × Retargeting Attribution WeightRetargeting Attribution = (2/4) × Total Conversion Value = 50% of conversion valueThese formulas enable precise measurement of retargeting effectiveness. Calculate these metrics weekly to track trends over time and identify performance changes before they significantly impact your budget.
Benchmarks: What's Good Retargeting ROAS by Industry
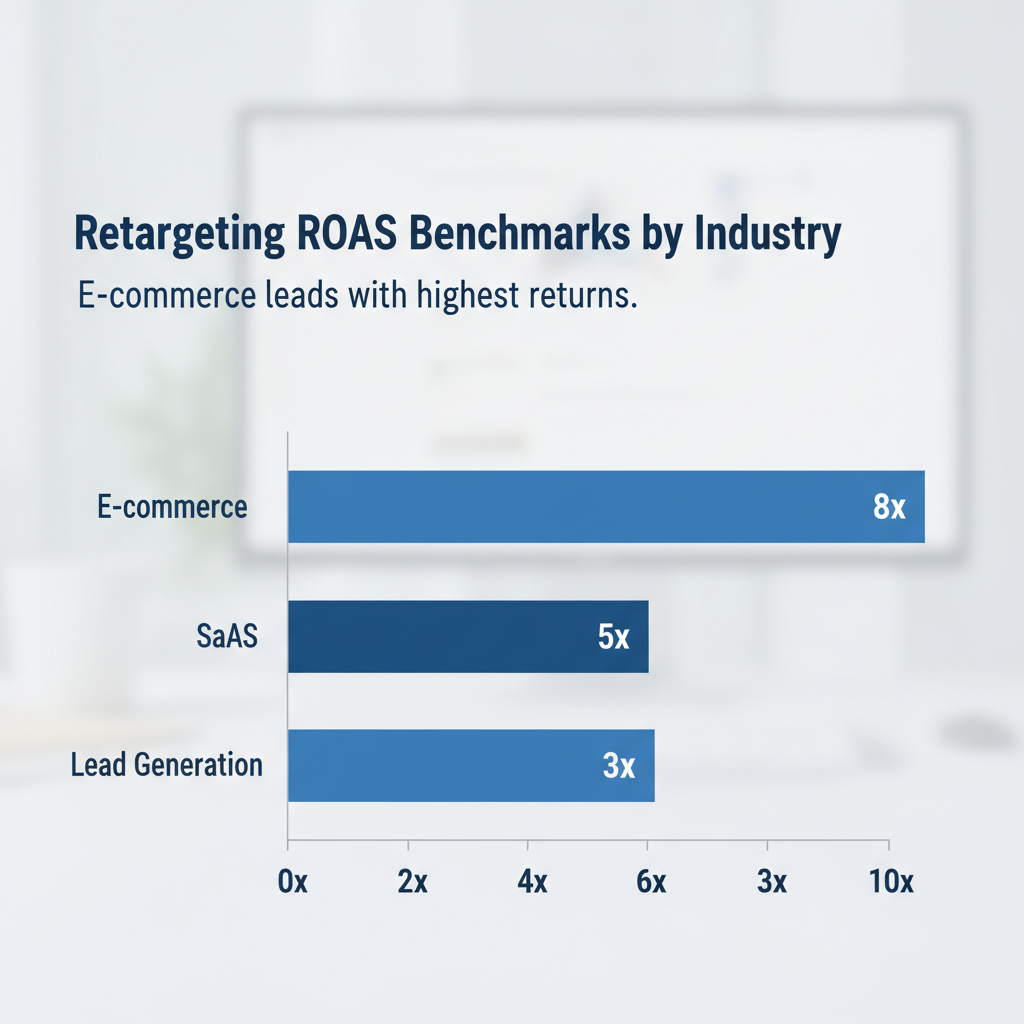
Retargeting ROAS varies significantly by industry, product price point, and business model. Here are realistic benchmarks based on 2025-2026 industry data:
E-commerce Retargeting Benchmarks: Fashion & Apparel- Excellent ROAS: 8-12x (incremental: 5-8x)
- Good ROAS: 5-8x (incremental: 3-5x)
- Average ROAS: 3-5x (incremental: 2-3x)
- Typical baseline rate: 35-40%
- Excellent ROAS: 6-10x (incremental: 4-7x)
- Good ROAS: 4-6x (incremental: 2.5-4x)
- Average ROAS: 2.5-4x (incremental: 1.5-2.5x)
- Typical baseline rate: 30-35%
- Excellent ROAS: 5-8x (incremental: 3-5x)
- Good ROAS: 3-5x (incremental: 2-3x)
- Average ROAS: 2-3x (incremental: 1.3-2x)
- Typical baseline rate: 40-45%
- Excellent ROAS: 10-15x (incremental: 6-10x)
- Good ROAS: 6-10x (incremental: 4-6x)
- Average ROAS: 4-6x (incremental: 2.5-4x)
- Typical baseline rate: 30-35%
- Excellent ROAS: 8-12x (based on customer lifetime value)
- Good ROAS: 5-8x
- Average ROAS: 3-5x
- Typical baseline rate: 25-30%
- Excellent ROAS: 6-10x
- Good ROAS: 4-6x
- Average ROAS: 2.5-4x
- Typical baseline rate: 30-35%
- Excellent ROAS: 5-8x
- Good ROAS: 3-5x
- Average ROAS: 2-3x
- Typical baseline rate: 35-40%
- Average Order Value (AOV): Higher AOV typically supports higher acceptable CPA and may show higher ROAS
- Product Margin: Higher margins allow for lower ROAS while remaining profitable
- Purchase Frequency: Repeat purchase products can justify lower initial ROAS if lifetime value is strong
- Competition Level: Highly competitive niches often show lower ROAS due to auction pressure
- Audience Quality: Retargeting audiences from high-intent actions (cart abandoners) outperform general site visitors
- Time in Market: Mature retargeting campaigns often see declining ROAS as the most responsive users convert early
Expect ROAS fluctuations throughout the year:
- Q4 (October-December): Often 30-50% higher ROAS due to holiday shopping intent
- January: Typically 20-30% lower as consumers recover from holiday spending
- Summer (June-August): Usually 10-20% below annual average for most categories
- Back-to-School (August-September): Strong for relevant categories
Don't panic over short-term ROAS drops if they align with predictable seasonal patterns. Instead, adjust budgets and expectations accordingly.
Common Mistakes in Retargeting ROI Calculation
Avoid these frequent errors that lead to misguided strategy decisions:
Mistake 1: Ignoring Baseline ConversionsThe most common error is crediting retargeting with 100% of conversion value when some percentage would have converted without additional ads. This inflates ROAS by 40-60% on average.
Solution: Implement holdout testing where 5-10% of your retargeting audience doesn't see ads. Compare conversion rates between exposed and unexposed groups. Use this baseline rate in all ROAS calculations. Mistake 2: Inconsistent Attribution WindowsComparing campaigns with different attribution settings creates false performance differences. A 28-day attribution window will always show higher ROAS than a 7-day window for the same campaign.
Solution: Standardize attribution windows across all retargeting campaigns. Use the same settings for performance comparisons. Document which attribution model you're using when reporting ROAS. Mistake 3: Not Accounting for Ad Platform Reporting DiscrepanciesFacebook attributes conversions differently than Google Analytics, which differs from your e-commerce platform. These discrepancies can create 20-40% variance in reported revenue.
Solution: Choose one source of truth (typically your e-commerce platform) and reconcile all ROAS calculations to that data source. Track the variance between platforms to understand typical discrepancies. Mistake 4: Overlooking View-Through ConversionsFocusing only on click-through conversions undercounts retargeting effectiveness, especially for awareness-stage retargeting.
Solution: Include view-through conversions in your ROAS calculation but use a shorter attribution window (1-day) to avoid overcounting. Segment click vs. view-through performance to understand both mechanisms. Mistake 5: Comparing Retargeting to Prospecting ROAS DirectlyRetargeting should have higher ROAS than prospecting because you're targeting warmer audiences. Expecting similar ROAS from both creates unrealistic prospecting goals or underinvestment in retargeting.
Solution: Set separate ROAS targets for prospecting and retargeting. Typical targets: Prospecting 2-3x, Retargeting 4-6x (depending on baseline assumptions). Mistake 6: Ignoring Frequency EffectsHigh-frequency retargeting (10+ impressions per user) shows inflated ROAS because you're hitting the same converted users repeatedly. This waste doesn't show up in basic ROAS metrics.
Solution: Monitor frequency alongside ROAS. Cap frequency at 7-10 impressions per week. Analyze ROAS by frequency segment to identify the point of diminishing returns. Mistake 7: Short-Term Performance EvaluationJudging retargeting ROAS on daily or even weekly performance creates noise and leads to premature optimization decisions.
Solution: Evaluate retargeting ROAS over 30-day periods minimum. Allow at least 7-14 days for new campaigns to stabilize before making optimization decisions. Mistake 8: Not Segmenting by Audience Intent LevelCombining ROAS from cart abandoners (high intent) with general site visitors (low intent) masks significant performance differences and optimization opportunities.
Solution: Calculate separate ROAS for each retargeting audience segment: cart abandoners, product viewers, homepage visitors, etc. Allocate budget based on segment-specific performance.Avoiding these mistakes ensures your retargeting ROAS calculations reflect true performance and guide effective optimization decisions.
Optimization Strategies Based on Your ROAS
Use your retargeting ROAS data to drive specific optimization actions:
If ROAS is 2x or Lower (Below Threshold) Immediate Actions:- Reduce budget by 30-50% while investigating
- Increase frequency caps to prevent overexposure
- Tighten audience definition to recent visitors only (7-14 days)
- Audit conversion tracking for technical issues
- Review creative for relevance and message match
- Revisit offer strength—is your incentive compelling enough?
- Test urgency mechanisms (limited-time discounts, low stock alerts)
- Segment audiences and pause lowest-performing segments
- Consider whether retargeting is appropriate for your offer/business model
- Test new creative angles and formats
- Implement sequential messaging (awareness → consideration → conversion)
- Refine audience segmentation to separate high and low intent
- Test shorter lookback windows to focus on recent visitors
- Experiment with different offers/discounts
- Maintain current budget while testing improvements
- Shift budget toward highest-performing audience segments
- Test increased spend on top segments to explore scaling potential
- Gradually increase budget by 20-30% while monitoring efficiency
- Expand to similar audiences or broader lookback windows
- Test additional placements or platforms
- Implement predictive audiences (lookalikes of retargeting converters)
- Develop creative rotation system to prevent fatigue
- Increase frequency caps slightly to test incremental reach
- Expand from dynamic retargeting to strategic retargeting campaigns
- Layer retargeting with email remarketing for multi-channel approach
- Increase budget by 50-100% while monitoring for efficiency drops
- Expand audience lookback windows (30, 60, 90 days)
- Test broader audience definitions (all site visitors, not just key actions)
- Launch retargeting on additional platforms
- Increase bid caps to capture more auction opportunities
- Monitor frequency weekly to prevent overexposure during scaling
- Track incremental ROAS separately from total ROAS
- Implement control groups to verify lift maintains during scaling
- Set ROAS floor (e.g., 4x) as circuit breaker if efficiency declines
- If ROAS is declining: Switch from automatic placements to Facebook Feed and Instagram Feed only
- If ROAS is strong: Enable Advantage+ catalog ads for automated dynamic retargeting
- Use Campaign Budget Optimization to let the algorithm allocate between audience segments
- Strong ROAS: Expand to Similar Audiences and Customer Match lists
- Weak ROAS: Limit placements to managed placements only, removing automatic placement expansion
- Use responsive display ads with multiple asset variations for creative testing
- High ROAS: Enable Smart Creative Optimization
- Low ROAS: Focus retargeting on video viewers and engagers only, excluding general site visitors
- Test Spark Ads using organic content that already performs well
- ROAS declining 15%+ from baseline: Refresh creative immediately
- ROAS stable for 60+ days: Proactively refresh 50% of creative assets
- ROAS improving: Continue current creative while testing new variations
- Frequency above 8 with declining ROAS: Priority creative refresh needed
Your retargeting ROAS isn't just a performance metric—it's a diagnostic tool that should drive specific optimization actions. By implementing these strategies based on your actual ROAS performance, you can systematically improve efficiency and scale profitable retargeting campaigns.
Conclusion: Action Steps to Improve Your Retargeting ROI
Measuring and optimizing retargeting ROAS requires a more sophisticated approach than standard campaign analysis. The key is understanding that retargeting works in tandem with your other marketing efforts, making incremental lift the most important metric to track.
Here are your immediate action steps:
This Week:- Implement baseline conversion tracking through holdout groups (5-10% of audience)
- Standardize attribution windows across all retargeting campaigns
- Calculate current incremental ROAS using the formulas in this guide
- Audit frequency metrics to identify potential overexposure
5. Use our ROAS Calculator to establish your baseline metrics
- Segment retargeting audiences by intent level and calculate separate ROAS for each
- Implement view-through conversion tracking with appropriate attribution windows
- Set up weekly ROAS reporting with incremental metrics included
- Test creative refresh for any campaigns with frequency above 7
- Review and adjust budgets based on segment-specific ROAS performance
- Establish ROAS benchmarks for each audience segment and platform
- Implement systematic creative rotation to prevent fatigue
- Test sequential messaging strategies for different audience segments
- Expand successful retargeting campaigns to additional platforms
- Calculate and track CPA metrics alongside ROAS for complete picture
Remember that retargeting success isn't about achieving the highest possible ROAS—it's about maximizing incremental profit while efficiently converting your warm audience. A 4x incremental ROAS that scales to $100,000 in monthly spend is far more valuable than a 10x ROAS limited to $5,000 monthly because of audience size constraints.
By implementing proper measurement methodologies, avoiding common calculation mistakes, and using ROAS data to drive optimization decisions, you'll transform retargeting from a supplementary tactic into a predictable, scalable revenue driver for your business.
Start with accurate measurement, optimize based on data, and scale what works. Your retargeting ROAS will become not just a metric you track, but a lever you pull to drive profitable growth.