Retargeting Campaign Success Metrics: KPIs Beyond ROAS
Most marketers obsess over ROAS when measuring retargeting campaign performance. While return on ad spend matters, relying on ROAS alone is like driving while looking only at your speedometer—you're tracking one important metric but missing critical information that determines whether you're actually heading in the right direction.
Traditional metrics like clicks, impressions, and even ROAS don't tell the full retargeting story. Retargeting campaigns operate fundamentally differently than prospecting campaigns, requiring a unique set of success indicators. A campaign with strong ROAS might be underperforming if frequency is through the roof. Another campaign with modest ROAS could be your best performer when you account for incremental lift and assisted conversions.
This guide reveals the complete metrics framework for measuring retargeting success. You'll learn which KPIs actually matter, how to interpret them in retargeting context, and how to build a measurement system that drives better optimization decisions.
Core Retargeting Metrics That Matter
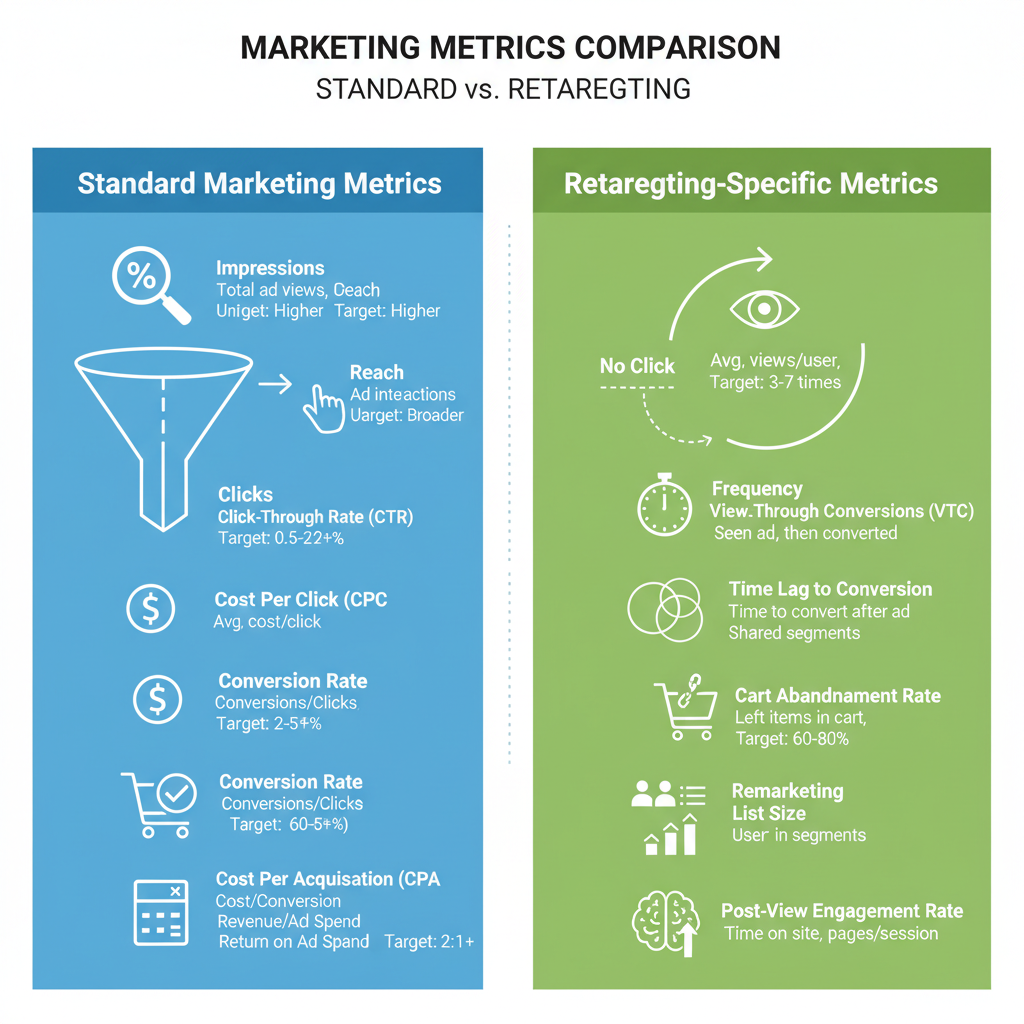
Beyond basic performance indicators, these metrics provide insight into retargeting effectiveness:
Incremental Conversion RateThe difference in conversion rates between users exposed to retargeting ads and those who aren't. This is the single most important retargeting metric because it measures actual impact, not just correlation.
How to calculate: Set up a holdout group representing 5-10% of your retargeting audience who won't see ads. Compare conversion rates: Example: If exposed users convert at 8% and control converts at 5%:Incremental Lift = (8% - 5%) / 5% = 60% liftIncremental Lift = (8% - 5%) / 5% = 60% liftVTCR = View-Through Conversions / ImpressionsExample: 500 view-through conversions from 2,000,000 impressions = 0.025% VTCRReturn Visit Rate = Unique Return Visitors / Unique Users ReachedReturn Visit Rate = 3,200 / 10,000 = 32%Engaged View Rate = Engaged Views / Total ImpressionsCost Per Return Visit = Total Ad Spend / Total Return VisitorsCost Per Return Visit = $5,000 / 3,200 = $1.56Assist Rate = Assisted Conversions / (Last-Click Conversions + Assisted Conversions)Assist Rate = 300 / (200 + 300) = 60%Frequency and Reach in Retargeting Context
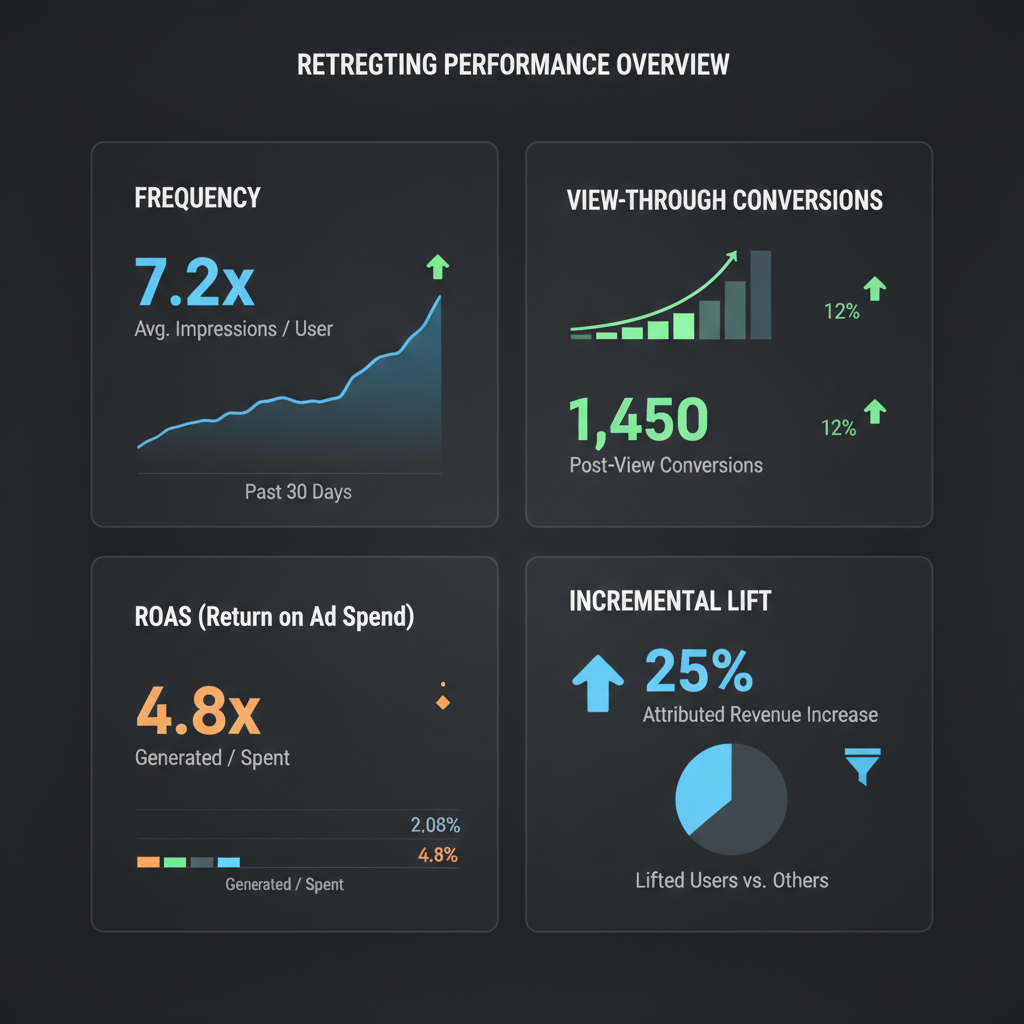
Frequency management is critical for retargeting success. Unlike prospecting campaigns where you continuously reach new users, retargeting works with finite audiences where overexposure creates waste and irritation. Frequency Metric Average number of times each user sees your retargeting ad within a time period. Calculation:Frequency = Total Impressions / Total ReachFrequency = 800,000 / 100,000 = 8 impressions per user- Awareness Retargeting: 3-5 impressions per week
- Consideration Retargeting: 5-8 impressions per week
- Conversion Retargeting: 7-12 impressions per week
- Cart Abandonment: 8-15 impressions over 7 days
- Frequency above 15: Almost certainly experiencing diminishing returns and wasted spend
- Frequency below 2: Likely not achieving sufficient exposure for retargeting to work effectively
- Rapidly increasing frequency: Audience saturation, need to expand or refresh
- Frequency 1-3: ROAS 3.2x, 15% of conversions
- Frequency 4-7: ROAS 5.8x, 50% of conversions
- Frequency 8-10: ROAS 4.1x, 25% of conversions
- Frequency 11+: ROAS 2.3x, 10% of conversions
Effective Reach = Users at Optimal Frequency / Total Users Reached- 30,000 users saw ads 1-3 times
- 45,000 users saw ads 4-10 times
- 25,000 users saw ads 11+ times
Effective Reach = 45,000 / 100,000 = 45%Reach Depletion Rate = 7-Day Reach / Total Audience SizeReach Depletion Rate = 80,000 / 200,000 = 40% per weekUnique Reach Rate = Unique Users Reached / Total Retargeting Audience SizeUnique Reach Rate = 75,000 / 250,000 = 30%View-Through Conversions Explained
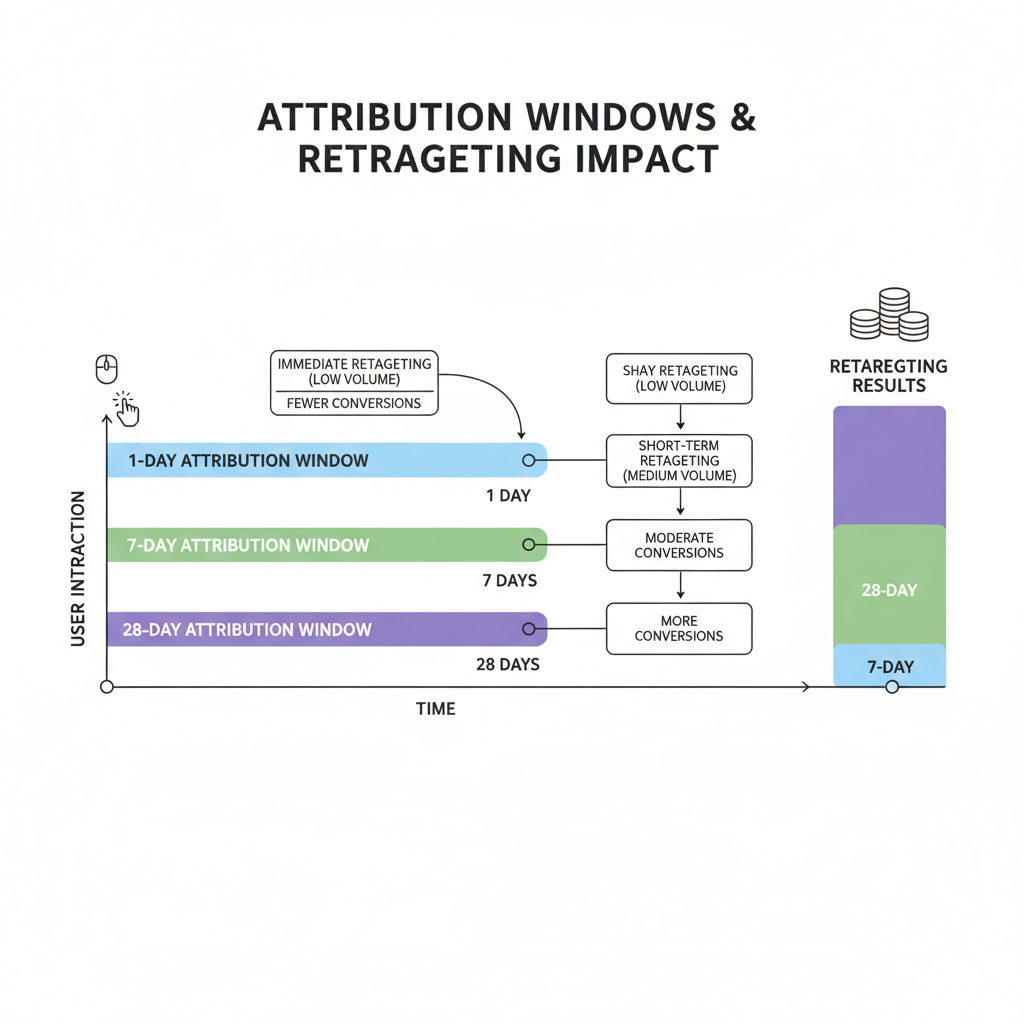
View-through conversions (VTC) are often misunderstood and underutilized in retargeting measurement. Unlike click-through conversions where a user clicks your ad then converts, view-through conversions occur when users see your ad without clicking, then later convert. Why View-Through Matters for Retargeting Retargeting builds awareness and consideration, not just direct response. Many users need to see your ad multiple times before they're ready to take action. They might see your retargeting ad on mobile while commuting, then convert hours later on desktop after remembering your brand. View-through conversions capture this awareness-driven behavior that click-through metrics miss entirely. View-Through Attribution Window The time period after seeing an ad during which conversions count as view-through. Common settings:- 1-day view: Conservative, captures only conversions very likely influenced by the ad
- 7-day view: Moderate, balances attribution accuracy with capturing legitimate influence
- 28-day view: Aggressive, risks overcrediting ads for conversions driven by other factors
- View-through: 50-70% of total conversions
- Click-through: 30-50% of total conversions
- View-through: 35-50% of total conversions
- Click-through: 50-65% of total conversions
- View-through: 15-30% of total conversions
- Click-through: 70-85% of total conversions
- Possible ad avoidance—users interested but not clicking ads
- Landing page concerns—users prefer direct site entry
- Attribution window too long—capturing coincidental conversions
- Strong brand recall—ads driving consideration without clicks
- Creative not memorable or distinctive
- Poor frequency—not enough exposures for awareness impact
- Attribution window too short—missing legitimate influence
- Audience already highly familiar with brand
Weighted Revenue = (Click-Through Revenue × 1.0) + (View-Through Revenue × 0.5)- Click-through revenue: $20,000
- View-through revenue: $15,000
Weighted revenue: ($20,000 × 1.0) + ($15,000 × 0.5) = $27,500
Weighted Revenue = (Click-Through Revenue × 1.0) + (View-Through Revenue × 0.7)Weighted revenue: ($20,000 × 1.0) + ($15,000 × 0.7) = $30,500
Total Revenue = Click-Through Revenue + View-Through RevenueTotal revenue: $20,000 + $15,000 = $35,000
- Create a holdout group of 10% of retargeting audience
- Show ads with impression tracking but prevent conversions from being counted
- Compare actual conversions between impression-only group and full campaign group
- Calculate incremental lift from impressions alone
Attribution Windows for Retargeting
- Best for: Short sales cycles, impulse purchases, promotional offers
- Pros: Attributes only very direct conversions, minimizes overcounting
- Cons: Undercounts retargeting influence on consideration-driven purchases
- Typical impact: Shows 20-35% lower ROAS than 7-day
- Best for: Standard e-commerce, most B2C purchases, SaaS trials
- Pros: Captures typical decision cycles, industry standard for comparison
- Cons: May overcount for very short cycles, undercount for longer cycles
- Typical impact: Balanced attribution, standard baseline
- Best for: High-consideration purchases, B2B, expensive items, complex decisions
- Pros: Captures extended decision periods, accounts for research cycles
- Cons: May attribute conversions that would have happened anyway
- Typical impact: Shows 40-70% higher ROAS than 7-day
- Recommended for: Most retargeting campaigns
- Rationale: Warm audiences should convert quickly if ad drives action
- Impact: Conservative VTC counts, minimizes coincidental conversions
- Recommended for: Awareness-focused retargeting, complex products
- Rationale: Allows for consideration period after ad exposure
- Impact: Moderate VTC counts, balances capture and accuracy
- Click: 1-day
- View: 1-day
- Example products: Fashion accessories, consumables, digital products
- Click: 7-day
- View: 1-day
- Example products: Standard e-commerce, subscription trials, promotional offers
- Click: 7-day
- View: 7-day
- Example products: Higher-ticket e-commerce, software purchases, service signups
- Click: 28-day
- View: 7-day
- Example products: B2B solutions, expensive equipment, complex services
- Meta (Facebook/Instagram): 7-day click, 1-day view
- Google Ads: 30-day click, 1-day view
- TikTok: 7-day click, 1-day view
- LinkedIn: 30-day click, 1-day view
- Pinterest: 30-day click, 1-day view
- Standardize across platforms: Use same windows for all retargeting campaigns
- Document your settings: Note attribution windows when reporting ROAS
- Test window sensitivity: Compare performance at different windows to find optimal setting
- Adjust conservatively: Err toward shorter windows for retargeting warm audiences
- Segment reporting: Track both conservative (1-day click) and moderate (7-day click) ROAS
- 1-day click ROAS: 3.2x ($32,000 revenue)
- 7-day click ROAS: 4.8x ($48,000 revenue)
- 28-day click ROAS: 6.1x ($61,000 revenue)
- Campaign Budget Optimization: Shorter windows favor high-intent audiences, longer windows favor awareness tactics
- Bid Strategy: Longer windows support higher bids by crediting more conversions
- Audience Selection: Shorter windows reward recency (recent visitors), longer windows reward reach
Calculating Incremental Lift
Incremental lift is the gold standard metric for measuring retargeting effectiveness. It answers the critical question: How many conversions happened because of retargeting that wouldn't have occurred otherwise? The Incrementality Problem Basic ROAS measurement suffers from a fundamental flaw: it credits retargeting with all conversions from retargeted users, even those who would have converted without seeing any ads. This is called the baseline or organic conversion rate. For retargeting, baseline conversions are particularly high because you're targeting users who already visited your site and showed interest. Some percentage will naturally return and convert without any additional advertising. Setting Up Incrementality Testing Create a holdout experiment to measure true incremental impact:Step Create Holdout Group
Randomly select 5-10% of your retargeting audience to exclude from seeing ads. This control group experiences no retargeting while the treatment group sees your normal campaign.Step Track Both Groups
Monitor conversions from both groups over the same time period (typically 30-60 days).Step Calculate Incremental Lift
Example Data:Control group (no ads): 10,000 users, 400 conversions = 4.0% conversion rateTreatment group (with ads): 90,000 users, 4,500 conversions = 5.0% conversion rate
Incremental Lift % = ((Treatment Rate - Control Rate) / Control Rate) × 100Incremental Lift % = ((5.0% - 4.0%) / 4.0%) × 100 = 25% liftStep Calculate Incremental Conversions
Incremental Conversions = Treatment Conversions - (Treatment Users × Control Rate)Incremental Conversions = 4,500 - (90,000 × 0.04) = 4,500 - 3,600 = 900Step Calculate Incremental ROAS
Incremental ROAS = (Incremental Conversions × Average Order Value) / Ad SpendIncremental ROAS = (900 × $100) / $30,000 = $90,000 / $30,000 = 3.0xBasic ROAS = (4,500 × $100) / $30,000 = $450,000 / $30,000 = 15.0xThe apparent 15x ROAS dramatically overstates true impact because it credits retargeting with all conversions, including the 3,600 that would have happened anyway.
Incremental Lift by Audience SegmentDifferent retargeting audiences show different baseline rates and incremental lift:
Cart Abandoners:- Baseline conversion rate: 8-15% (high—many already intend to purchase)
- Typical incremental lift: 20-40%
- Interpretation: Retargeting provides gentle reminder but most were likely to convert
- Baseline conversion rate: 2-5%
- Typical incremental lift: 50-100%
- Interpretation: Retargeting significantly increases conversion likelihood
- Baseline conversion rate: 0.5-2%
- Typical incremental lift: 100-200%
- Interpretation: Retargeting has strong impact on lower-intent users
This reveals that retargeting often delivers highest incremental lift (percentage increase) on lower-intent audiences but highest incremental conversion volume on high-intent audiences.
Ongoing Incrementality MonitoringYou can't run holdout tests constantly, but you can estimate incremental lift:
Method 1: Periodic TestingRun incrementality tests quarterly or biannually to establish baseline rates, then apply those rates to ongoing performance.
Method 2: Statistical ModelingUse historical data to model expected baseline conversion rates based on user behavior characteristics, then compare actual conversions to modeled baseline.
Method 3: Platform ToolsMeta offers Conversion Lift Studies and Google provides experimental approaches through campaign experiments to measure incrementality.
Incremental Lift BenchmarksRealistic incremental lift by retargeting strategy:
- Dynamic Product Retargeting: 40-80% lift
- Static Brand Retargeting: 30-60% lift
- Sequential Messaging: 50-90% lift
- Cart Abandonment: 20-50% lift
- Cross-Sell Retargeting: 60-100% lift
Lower lift percentages aren't necessarily worse if the baseline rate is high—absolute incremental conversions matter more than lift percentage.
Using Incremental Lift for OptimizationOnce you know your incremental lift, you can:
1. Calculate true incremental ROAS for accurate profitability analysis
2. Compare segments to identify which audiences benefit most from retargeting
3. Optimize frequency by testing how lift changes at different frequency levels
4. Set realistic targets based on incremental rather than apparent performance
5. Allocate budget toward highest-lift segments and campaigns
Incremental lift transforms retargeting from a correlation metric (retargeted users convert) to a causation metric (retargeting causes conversions). This is the difference between reporting activity and proving value.
Platform-Specific Retargeting Metrics
Different platforms provide unique metrics that offer additional insight into retargeting performance. Here's what to track on each major platform:
Meta (Facebook/Instagram) Specific Metrics Cost Per 1,000 People Reached:Different from CPM (cost per 1,000 impressions), this shows cost to reach unique users. For retargeting with high frequency, you'll serve many impressions to each user, making cost per people reached 3-5x higher than CPM.
Target: $5-$15 for retargeting campaigns
Hook Rate (Video Ads):Percentage of users who watch at least 3 seconds of your video. Indicates whether your opening creative captures attention.
Target: 40-60% for retargeting (should be higher than prospecting)
Hold Rate (Video Ads):Percentage of users who watch at least 15 seconds or to completion. Shows message resonance.
Target: 15-30% for retargeting
Outbound Click Rate:Percentage of impressions that result in clicks to your website. Different from CTR which may include other engagement.
Target: 1.5-3.5% for retargeting (significantly higher than prospecting's 0.5-1.2%)
Google Display Network Specific Metrics Active View Viewable Impressions:Impressions where at least 50% of the ad was visible for 1+ seconds. Indicates actual exposure quality.
Target: 70-85% viewability rate
Relative CTR:Your CTR compared to other advertisers targeting the same placements. Shows competitiveness of your creative.
Target: 1.0x or higher (matching or beating competitors)
Engagement Rate:Interactions with rich media ads (expansions, video plays, etc.) divided by impressions.
Target: 3-8% for interactive display ads
TikTok Specific Metrics 6-Second Video Views:Users who watched at least 6 seconds of your video ad. Key engagement threshold on TikTok.
Target: 30-50% of impressions for retargeting
Video Play Actions:Users who actively engaged (pause, rewind, expand) with your video.
Target: 5-12% of video views
Average Watch Time:Average duration users watched your video ad.
Target: 8-12 seconds for 15-second ads, 12-18 seconds for 30-second ads
LinkedIn Specific Metrics Social Actions:Likes, comments, and shares on your sponsored content.
Target: 1-3% engagement rate for B2B retargeting
Lead Form Open Rate:For lead gen campaigns, percentage of clicks that open your lead form.
Target: 40-60% (retargeting should show higher rates than cold traffic)
YouTube Specific Metrics View-Through Rate (VTR):Percentage of impressions where user watched 30 seconds or to completion.
Target: 15-30% for retargeting (2-3x higher than prospecting)
Earned Actions:Subscriptions, playlist additions, and watch time gained from users who engaged with your ad.
Target: Track trend over time; increasing earned actions show strong content resonance
Platform Comparison FrameworkTrack these standardized metrics across all platforms for comparison:
1. Effective CPM: Cost to reach 1,000 unique users at optimal frequency
2. Qualified Click Rate: Clicks that result in site visits over 10 seconds
3. Return Visit Rate: Site visits from ad recipients / users reached
4. Cost Per Return Visit: Total spend / total return visits
5. View-Adjusted ROAS: ROAS accounting for view-through conversions
6. Incremental ROAS: ROAS after removing baseline conversions
These normalized metrics allow you to compare retargeting efficiency across platforms despite different interfaces and native metrics.
Setting Up Your Retargeting Dashboard
A comprehensive retargeting measurement system requires organizing multiple data sources into a cohesive dashboard. Here's how to build one:
Dashboard Structure Section 1: Executive Overview- Total retargeting spend (current month)
- Incremental ROAS (weighted for accuracy)
- Incremental conversions
- Cost per incremental conversion
- Month-over-month trend arrows
- Basic ROAS (for platform comparison)
- Incremental ROAS (for true performance)
- Click-through conversions
- View-through conversions
- View-through percentage
- Assisted conversions
- Total conversions (all attribution)
- Unique users reached
- Impressions delivered
- Average frequency
- Effective reach percentage (users at optimal frequency)
- Cost per 1,000 users reached
- Return visit rate
- Cost per return visit
- CTR (overall and by creative)
- Engagement rate
- Video completion rate (if applicable)
- Frequency by creative (to spot fatigue)
- Creative refresh date (to track rotation)
Breakdown by retargeting audience:
- Cart abandoners
- Product viewers
- Homepage visitors
- Past purchasers
- Other custom segments
For each segment show: Spend, ROAS, incremental lift, conversions
Section 6: Platform ComparisonSide-by-side metrics across platforms:
- Meta (Facebook/Instagram)
- Google (Display/YouTube)
- TikTok
- Other platforms
- 7-day and 30-day trend charts for key metrics
- Automatic alerts for:
- ROAS drops >15%
- Frequency exceeds thresholds
- Reach depletion >50% weekly
- CPM increases >20%
- Conversion rate drops >10%
Data Sources to Connect1. Ad Platform APIs: Facebook, Google, TikTok, etc.
2. Analytics Platform: Google Analytics, Adobe Analytics
3. Attribution Tool: Your multi-touch attribution system
4. CRM/Database: For customer lifetime value and repeat purchase tracking
5. Incrementality Tests: Periodic holdout test results
Dashboard Tools Option 1: Google Looker Studio (Free)- Connect ad platform data via native connectors
- Build custom visualizations
- Share with stakeholders
- Limitation: Some manual data preparation needed
- Pull ad platform data into Google Sheets
- Create calculations for custom metrics
- Build pivot tables and charts
- Limitation: Scales poorly beyond 100k rows
- Enterprise-grade visualization
- Handles large datasets
- Advanced calculations and modeling
- Limitation: Requires license and technical setup
- Full control over metrics and calculations
- Integrate proprietary data
- Tailored to your specific needs
- Limitation: Requires development resources
- Real-time: Spend, impressions, clicks (for budget monitoring)
- Daily: Conversions, ROAS, frequency (for quick issue detection)
- Weekly: Incremental metrics, segment analysis (for optimization decisions)
- Monthly: Incrementality tests, trends, forecasts (for strategic planning)
Create different views for different audiences:
Executive View: High-level KPIs, trends, and strategic insights Marketing Manager View: Detailed performance, optimization opportunities Media Buyer View: Campaign-level metrics, daily optimization data Analytics View: Attribution models, testing results, data quality metricsA well-structured dashboard transforms raw retargeting data into actionable insights, enabling faster optimization decisions and clearer communication with stakeholders.
Conclusion: Building a Complete Retargeting Measurement System
Measuring retargeting success requires moving beyond simplistic ROAS tracking to understand the full picture of campaign performance. The metrics that matter most—incremental lift, view-through conversions, frequency management, and assisted conversions—often receive less attention than basic click and conversion counts, yet they determine whether your retargeting actually drives business value.
Your Retargeting Metrics Framework: Tier 1 (Essential - Track Weekly):- Incremental ROAS (with baseline conversion adjustment)
- Frequency and effective reach
- Return visit rate
- View-through conversion percentage
- Cost per incremental conversion
- Incremental lift by audience segment
- Assisted conversion rate
- Attribution window sensitivity
- Reach depletion rate
- Platform-specific engagement metrics
- Incrementality test results
- Multi-touch attribution modeling
- Lifetime value of retargeted cohorts
- Creative fatigue analysis
- Cross-platform journey analysis
- Set up holdout groups for incrementality testing (5-10% of audience)
- Standardize attribution windows across all platforms
- Implement view-through conversion tracking with 1-day window
- Begin tracking frequency metrics by audience segment
5. Use ROAS Calculator and CPM Calculator for baseline measurements
- Build retargeting dashboard with Tier 1 metrics
- Calculate incremental ROAS for each audience segment
- Identify and cap high-frequency campaigns (>10 impressions/week)
- Analyze view-through vs click-through performance by campaign type
- Set segment-specific ROAS targets based on incremental data
- Complete initial incrementality testing cycle
- Implement multi-touch attribution tracking
- Develop creative refresh schedule based on frequency/performance data
- Build automated alerts for key metric thresholds
- Create stakeholder reporting templates
Traditional advertising measurement asks: "How much revenue did this campaign generate?"
Advanced retargeting measurement asks: "How much incremental revenue did this campaign generate that wouldn't have occurred otherwise, accounting for baseline conversions, multi-touch attribution, and both click and view-through mechanisms?"
This shift from correlation to causation, from apparent to incremental performance, transforms retargeting from a supplementary tactic into a precisely measured, systematically optimized revenue driver.
By implementing the metrics framework outlined in this guide, you'll move beyond surface-level ROAS numbers to understand the true contribution of your retargeting campaigns. You'll identify which audience segments deliver real incremental value, which frequency levels maximize efficiency, and how retargeting fits into your broader multi-channel attribution model.
Start with the essential metrics this week, build your measurement infrastructure this month, and refine your approach this quarter. The result will be retargeting campaigns you can measure accurately, optimize confidently, and scale profitably.
Measurement isn't just about reporting what happened—it's about understanding why it happened and what to do next. Build your complete retargeting measurement system, and you'll transform uncertainty into strategic advantage.