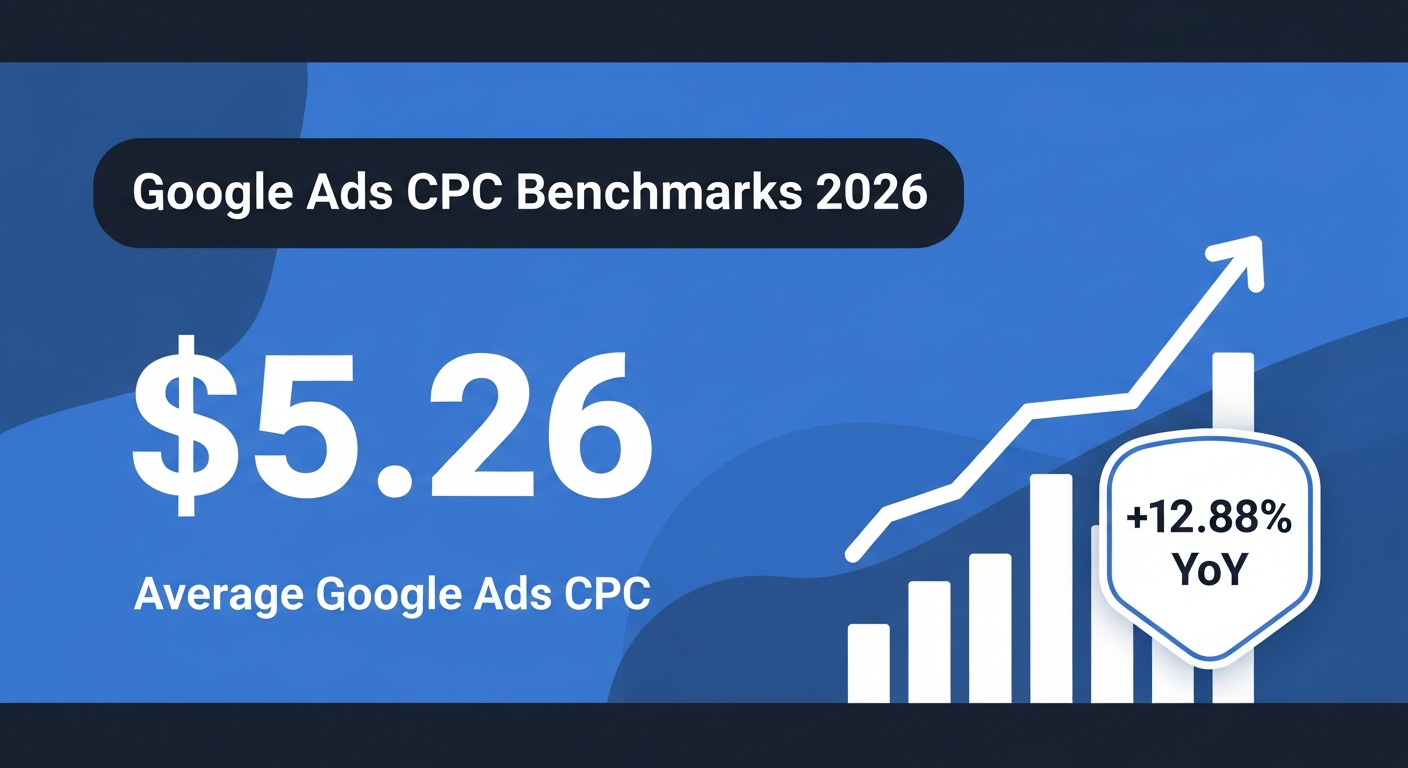
Google Ads cost-per-click has been climbing for years, and 2026 is no exception. The all-industry average CPC on Google Search now sits at $5.26 — a figure drawn from a WordStream analysis of 16,446 campaigns spanning April 2024 through March 2025, representing one of the largest CPC datasets available. That is roughly a 12.88% increase year over year, and the trend shows no signs of reversing.
If you are trying to justify Google Ads spend to a client or explain an inflated cost line in a performance review, this article gives you the data and the context to do it properly. We will cover where your industry fits in that average, what is mechanically pushing prices higher, how Search compares to Display, and practical levers you can pull today to lower your CPC without sacrificing the volume that matters.
The current state: Google Ads CPC in 2026
The $5.26 average CPC is a weighted aggregate. It includes legal services at one end and arts and entertainment at the other, with a spread of nearly $7 between the cheapest and most expensive verticals. For context:
- Google Search (all industries): $5.26 average CPC
- Google Display Network: $0.63 average CPC
- Bing Ads: $1.54 average CPC
- Meta Ads: $1.10 average CPC
These numbers exist on different planes. Meta and Bing are not apples-to-apples alternatives to Google Search — the intent behind a search query is categorically different from the passive scroll of a social feed. But the gap does matter when you are deciding where to allocate budget and what results to expect.
The year-over-year increase of approximately 12.88% compounds a multi-year trend. In dollar terms, an advertiser who was paying $4.66 per click last year is now paying $5.26 for the same traffic. Across thousands of monthly clicks, that difference is significant. Understanding why it is happening is the first step toward managing it.
CPC benchmarks by industry
The single most important adjustment you can make to any CPC benchmark conversation is to anchor it in your specific vertical. The all-industry average of $5.26 obscures a range that stretches from $1.60 to $8.58. The table below shows approximate CPC benchmarks by industry based on WordStream's 2024–2025 dataset.
| Industry | Average CPC | Notes |
|---|---|---|
| Legal | $8.58 | Highest CPC vertical; personal injury and DUI keywords frequently exceed $50–100 per click |
| Finance & Insurance | ~$7.00 | Mortgage, life insurance, and credit card keywords drive intense competition |
| B2B / Tech | ~$5.00 | SaaS and enterprise software keywords are competitive; long-tail B2B often lower |
| Healthcare | ~$4.50 | Regulated category; telehealth and elective procedures push costs higher |
| Education | ~$4.00 | Online degrees and professional certifications are the high-cost subcategories |
| Real Estate | ~$3.50 | Varies widely by market; major metros significantly above average |
| E-commerce / Retail | ~$2.50 | Shopping campaigns often lower than Search; branded terms are cheapest |
| Travel | ~$2.00 | High volume, lower margin; OTAs drive competition but not always in long-tail |
| Arts & Entertainment | $1.60 | Lowest CPC vertical; less commercial intent reduces advertiser competition |
Legal at $8.58 is five times the cost of Arts and Entertainment at $1.60. If your campaigns are in Legal or Finance and your blended CPC is $6–7, you are actually performing well. If your e-commerce campaigns are running at $5.26, you have a problem — that is double the industry expectation and needs investigation.
Use your industry benchmark as the baseline, not the all-industry average. The $5.26 figure is a useful headline number for board-level conversations, but your day-to-day optimisation target should be anchored in your vertical.
What's driving search costs up
Three structural forces are pushing Google CPC higher, and none of them are temporary.
More advertisers competing for the same intent
Google Search inventory is fundamentally constrained. There are only so many searches for "personal injury lawyer near me" or "project management software" in a given month. As digital advertising has matured, more businesses — from enterprise brands to solo operators — have shifted budget toward search intent. More bidders on the same finite supply produces one outcome: higher clearing prices at auction.
This effect is most visible in lower-funnel, high-commercial-intent keywords. Broad informational terms have seen more moderate increases. If your keyword portfolio skews heavily toward bottom-of-funnel buying queries, you are bearing the full force of this competition.
Performance Max and automated bidding inflation
Google's push toward Performance Max campaigns has consolidated control over auction dynamics. PMax uses automated bidding algorithms that optimise toward conversion targets rather than explicit CPC caps, and they bid aggressively when signals indicate conversion likelihood. This is useful for volume, but it can inflate CPCs because the system is willing to pay more if it believes the conversion probability justifies it.
Advertisers who have migrated large portions of their budget from standard Search to PMax frequently report higher CPCs alongside higher conversion volumes — the system is finding more conversions but at a higher per-click cost. The net ROAS impact varies, which is why tracking both metrics together matters. Use the ROAS Calculator to monitor whether your revenue-per-click efficiency is keeping pace with rising CPC.
AI-driven bid inflation across the ecosystem
Smart Bidding, Target CPA, and Target ROAS strategies are now the default for most advertisers. When every major advertiser in a competitive vertical is running AI-powered bid strategies that automatically increase bids when conditions favour conversion, auction prices rise across the board. No individual advertiser is overpaying — each is bidding rationally given their signals — but the collective effect is systematic CPC inflation.
This is a structural shift. The era of manually managing bids to find arbitrage opportunities against less sophisticated competitors is largely over in mature categories. Competing effectively now means feeding better signals to your bidding algorithm: tighter conversion tracking, customer match lists, and higher-quality landing page data.
Google Search vs Google Display: when to use each
The cost difference between Google Search ($5.26 CPC) and Google Display Network ($0.63 CPC) is not a hidden opportunity — it reflects a fundamental difference in what you are buying.
| Metric | Google Search | Google Display Network |
|---|---|---|
| Average CPC | $5.26 | $0.63 |
| Average CPM | Higher (auction-driven) | $3.00 |
| User intent | Active — user is searching for something | Passive — user is reading/browsing content |
| Conversion rate (typical) | Higher (3–8% range) | Lower (0.5–2% range) |
| Best use | Bottom-of-funnel, direct response | Awareness, retargeting, upper-funnel |
Google Display's $0.63 CPC looks appealing until you account for conversion rates. A Display click that converts at 0.5% costs $126 per conversion. A Search click that converts at 4% costs $131.50 per conversion at $5.26 CPC. The economics can actually be comparable — but only if Display is generating genuine conversions rather than accidental clicks.
Display shines in two scenarios: retargeting audiences who have already shown purchase intent on your site, and upper-funnel awareness campaigns where the objective is reach and recall rather than immediate conversion. If you are running Display purely because it is cheaper than Search, you are comparing the wrong metrics. Run the numbers with the CPA Calculator to see whether the lower click cost translates to a lower cost per acquisition.
For direct response campaigns aimed at acquiring customers now, Search remains the superior channel despite its higher CPC. The intent signal is irreplaceable.
Google vs Bing: the cost gap and when Bing makes sense
Bing Ads average CPC of $1.54 is nearly four times cheaper than Google at $5.26. That is not a rounding error — it is a 71% cost reduction for access to what is, in many categories, the same keyword inventory with similar commercial intent.
The reason for the gap is simple: fewer advertisers bid on Bing. Microsoft's search market share is smaller than Google's, which means less auction competition and lower clearing prices. The searches themselves — when a user types "compare project management software" or "best accountant near me" — carry roughly the same commercial intent regardless of which search engine they use.
When Bing outperforms its market share
Three audience profiles skew toward Bing in ways that matter for specific advertisers:
B2B and enterprise audiences. Microsoft products are deeply embedded in corporate environments. Bing is the default search engine on Windows machines in many organisations, and Microsoft Edge has grown its enterprise browser share. B2B advertisers targeting decision-makers at mid-to-large companies will find a disproportionate share of that audience on Bing relative to its overall market share.
Older demographics. Bing users skew older than Google users. If your product or service targets 45+ consumers — financial products, healthcare, home services — Bing's demographic profile is often a better fit than its market share numbers suggest.
High-CPC verticals. Legal, finance, and insurance advertisers paying $7–8+ per click on Google can dramatically reduce blended acquisition costs by running the same campaigns on Bing. Even if Bing generates 15–20% of the volume, the 70% cost reduction on that segment meaningfully improves overall account economics.
The practical approach: import your Google Ads campaigns directly into Microsoft Advertising. The conversion tracking setup takes a few hours. Run both platforms for 60–90 days and compare CPA, not just CPC. Bing's lower conversion volume can make statistical significance slower to reach, but the CPA comparison is usually the decisive metric.
How to calculate your target CPC (formula)
Rather than treating industry benchmarks as your CPC goal, calculate the maximum CPC your business economics can support. This gives you a ceiling — the highest you can bid and still remain profitable.
The formula:
Let's walk through a concrete example.
Scenario: E-commerce retailer selling fitness equipment
- Website conversion rate: 3.5%
- Average order value: $180
- Target profit margin on ad spend: 25% (meaning you want $0.25 in profit for every $1 spent on ads)
Step 1 — Calculate revenue per click:
3.5% conversion rate × $180 AOV = $6.30 revenue per click
Step 2 — Apply your margin target:
$6.30 × 25% margin = $1.575
Wait — that gives a maximum CPC of $1.58? That is below the e-commerce benchmark of $2.50. What gives?
This is the exercise working exactly as intended. If your conversion rate is 3.5% and AOV is $180 and you need 25% margin, then $1.58 is genuinely your ceiling. Paying the industry benchmark CPC of $2.50 would reduce your margin below target. You have three paths: accept lower margin, increase conversion rate (which increases revenue per click), or increase AOV through bundling or upsells.
Now run the numbers differently — same business but conversion rate has been optimised to 5% through landing page work:
5% × $180 × 25% = $2.25 maximum CPC
That is much closer to benchmark, and a 30% margin target would allow $2.70 — above benchmark, giving you bidding headroom. Conversion rate is not just a landing page metric; it directly determines what you can afford to pay per click.
Use the Break-Even ROAS Calculator to work backwards from your margin structure and find the ROAS threshold that keeps your campaigns profitable, then use that figure to set your Target ROAS bid strategy in Google Ads.
Practical ways to reduce CPC without losing volume
You cannot negotiate with Google's auction directly, but you have significant influence over the effective CPC you pay through Quality Score, keyword strategy, and campaign structure.
Quality Score: the most underused CPC lever
Quality Score is Google's 1–10 rating of the relevance and quality of your keywords, ads, and landing pages. It directly affects your Ad Rank, and Ad Rank determines both your position and the actual CPC you pay. The relationship is non-linear: improving Quality Score from 5 to 8 can reduce effective CPC by 30–40% while maintaining or improving position.
This is the single highest-leverage CPC reduction strategy available to most advertisers, and it is underused because the improvement is slower and less satisfying than simply lowering bids.
Quality Score has three components:
- Expected CTR: Whether your ad is likely to be clicked relative to competitors for the same keyword. Improve by writing more specific, benefit-focused ad copy that directly addresses the search query.
- Ad relevance: How closely your ad matches the intent of the keyword. Fix by grouping tightly themed keywords into smaller ad groups with dedicated ad copy — avoid cramming 50 keywords into one ad group.
- Landing page experience: Whether your landing page delivers on the ad's promise and loads quickly. Fix by ensuring the page headline matches the ad, page load time is under 2 seconds, and the content directly answers the searcher's query.
Check your Quality Scores in the Keywords view of Google Ads. Any keyword at QS 5 or below is costing you significantly more than it should. Prioritise improving Quality Score on your highest-spend keywords first — that is where the savings compound fastest.
Tighten match types
Broad match keywords trigger on searches that may have marginal relevance to your offering. Every irrelevant click you receive is wasted spend that inflates your effective CPA without contributing to conversions. Review your Search Terms report weekly and add negatives aggressively.
Moving a keyword from broad to phrase or exact match typically reduces impressions significantly, but the traffic that remains converts at a higher rate. Your CPC may not drop immediately — match type does not directly set CPC — but your conversion rate will rise, which improves Quality Score over time, which lowers CPC. Monitor your CTR when changing match types; a significant CTR improvement after tightening match types is a reliable signal that your previous broad traffic was poorly matched.
Ad scheduling and device bid adjustments
Not all clicks are equal. If your conversion data shows that mobile traffic converts at 60% the rate of desktop traffic, but you are paying the same CPC for both, you are overpaying for mobile relative to the value it delivers. Apply device bid modifiers to bring effective CPC into line with conversion value by device.
Similarly, if your account shows that conversions cluster heavily between 9am and 6pm on weekdays, running at full bids 24/7 means you are paying competitive CPCs during off-peak hours for traffic that is unlikely to convert. Ad scheduling lets you concentrate spend in windows where your conversion rate is highest.
Improve your conversion rate to make high CPCs sustainable
This point is worth stating explicitly: the most durable solution to expensive CPC is a higher conversion rate. At 2% conversion rate and $5.26 CPC, your cost per conversion is $263. At 4% conversion rate with the same CPC, it is $131.50. You have halved your CPA without changing a single bid.
Landing page optimisation — tighter message match, faster load times, clearer calls to action, social proof — has a better long-run ROI than almost any campaign-level optimisation. It also improves Quality Score, which then reduces CPC. The compounding effect of conversion rate work is significant: better conversion rate → better Quality Score → lower CPC → lower CPA → more budget available to reinvest.
Build out your negative keyword library
Every wasted click is a real CPC cost with zero conversion value. A well-maintained negative keyword list is one of the most reliable CPC-efficiency strategies available. Common negative keyword categories to audit:
- Informational queries with no commercial intent ("how to", "what is", "free")
- Competitor brand names (unless you are running a deliberate competitor targeting strategy)
- Job seeker terms ("jobs", "careers", "salary")
- Product categories you do not carry
- Geographic terms for locations you do not serve
Pull your Search Terms report for the past 90 days and sort by cost. The irrelevant terms consuming meaningful budget are almost always visible within the top 50 rows.
Review your bidding strategy against your conversion volume
Target CPA and Target ROAS bid strategies require sufficient conversion volume to function effectively — typically 30–50 conversions per month per campaign as a minimum. Below that threshold, the algorithm does not have enough data to make accurate bid decisions and tends to either underbid (missing volume) or overbid (inflating CPC). If your campaign is generating fewer than 30 conversions per month, Maximise Conversions or even Manual CPC with Enhanced CPC may produce more efficient results than Target CPA.
Consolidating campaigns is often the right move when conversion volume is spread thin. Fewer, larger campaigns give the algorithm better data density, which tends to improve both volume and CPC efficiency simultaneously.
Putting the numbers in context
A $5.26 average CPC in isolation is not good or bad — it is a market price. What matters is whether the conversions that CPC generates are profitable given your margins, lifetime value, and competitive position.
If your Legal firm generates $15,000 in fees from a single converted client and your campaign converts at 8%, a $8.58 CPC means you paid $107 to acquire a $15,000 client. That is exceptional economics despite paying the highest CPC in the benchmark table. Conversely, if your $2.50 e-commerce CPC generates customers who never reorder and have a 12% margin on a $40 AOV, your CPA of $71 is destroying value.
The benchmark is the starting point. The calculation that matters is whether your CPC supports profitable customer acquisition given your specific business model. Use the CPA Calculator to model your acquisition cost at different CPC and conversion rate assumptions, and the ROAS Calculator to verify that your return on ad spend covers your cost of goods and leaves margin for growth.
Rising CPCs are a permanent feature of a maturing paid search ecosystem. The advertisers who win in this environment are not the ones paying the lowest CPC — they are the ones generating the highest value from each click.