How to Calculate Meta Ads Profitability: ROAS & Key Metrics
You're spending $5,000 per month on Meta ads. Your dashboard shows a 4x ROAS. That looks good—until you realize you're losing money.
This happens more often than most marketers admit. Because ROAS alone doesn't tell you if your campaigns are actually profitable. It can't. And that gap between what looks successful and what makes money costs businesses thousands every month.
Here's what you need to know.
Understanding ROAS: The Foundation (And Its Limitations)
ROAS stands for Return on Ad Spend. The calculation is simple:
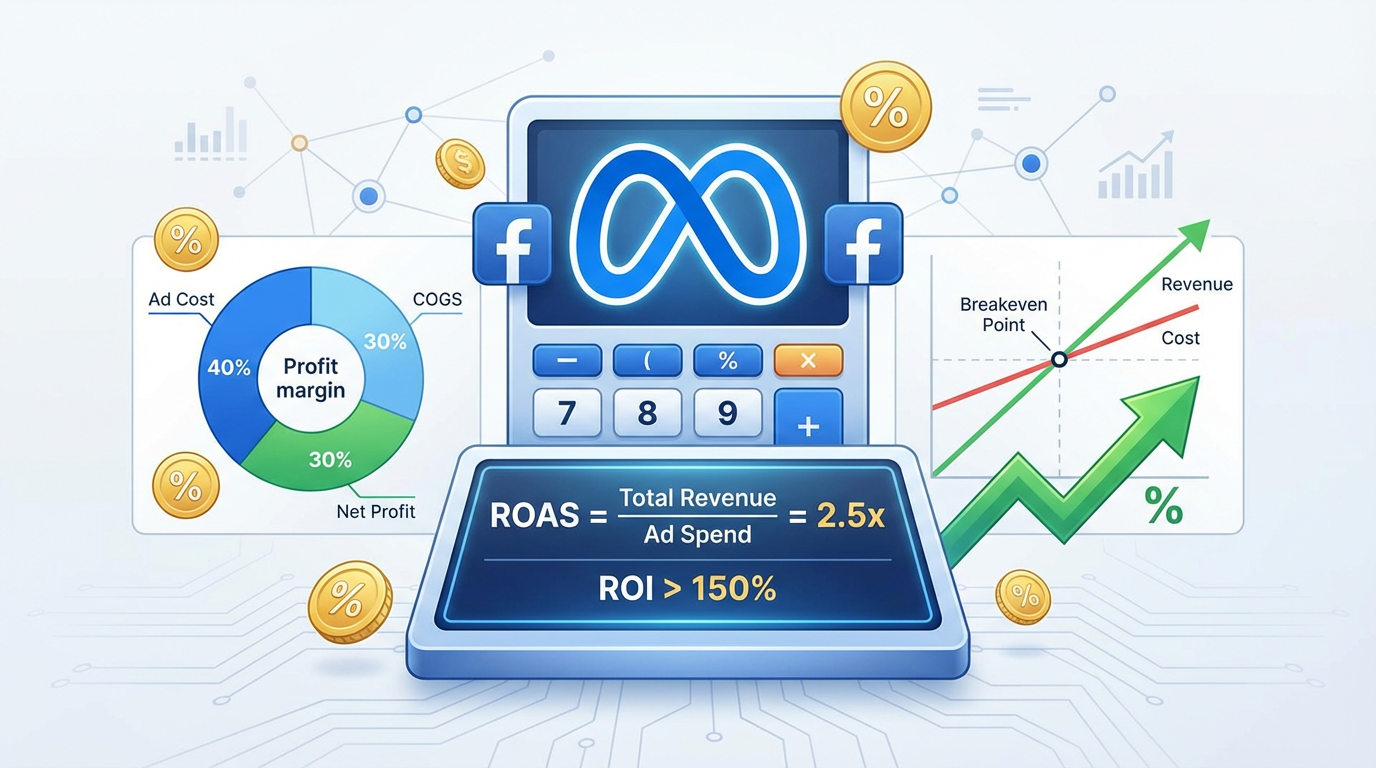
ROAS = Revenue from Ads ÷ Ad Spend
If you spend $1,000 on Meta ads and generate $4,000 in revenue, your ROAS is 4x (or 400%). Straightforward math. But here's where it gets tricky—that $4,000 in revenue isn't $4,000 in profit.
Let's say you sell a product for $100. Your cost of goods sold (COGS) is $60. That means your gross profit per sale is $40, not $100. Now factor in your ad spend, fulfillment costs, payment processing fees, overhead, and suddenly that 4x ROAS might barely break even.
This is why successful-looking campaigns hemorrhage cash.
Calculate your actual ROAS with our ROAS Calculator.
The Breakeven ROAS Formula You Actually Need
To calculate your true breakeven ROAS, you need to know your profit margin. Here's the formula:
Breakeven ROAS = 1 ÷ Profit Margin
If your profit margin is 25% (meaning you keep $25 for every $100 in revenue after all costs except advertising), your breakeven ROAS is:
1 ÷ 0.25 = 4x ROAS
Anything below 4x loses money. Anything above 4x generates profit. But most marketers stop here—and that's a mistake.
Because this calculation only accounts for direct costs. It doesn't include the operational expenses that keep your business running: salaries, software subscriptions, rent, utilities. These matter. A lot.
Factoring In Your Full Cost Structure
Let's work through a real example. You run an e-commerce store selling fitness equipment:
- Average order value: $150
- COGS: $75 (50% of revenue)
- Shipping and fulfillment: $15 (10% of revenue)
- Payment processing: $4.50 (3% of revenue)
- Customer service and returns: $7.50 (5% of revenue)
Your contribution margin per sale is $48 ($150 minus all those costs). That's 32% of revenue.
Using the breakeven formula: 1 ÷ 0.32 = 3.125x ROAS
But you also have monthly fixed costs of $10,000 (salaries, software, rent). If you generate $50,000 in monthly revenue, those fixed costs represent another 20% of revenue. Now your true profit margin drops to 12%.
Your actual breakeven ROAS: 1 ÷ 0.12 = 8.33x ROAS
See the problem? That 4x ROAS that looked profitable is actually losing you money—significant money. This is why businesses with "successful" Meta campaigns still struggle with cash flow.
Profitable ROAS Thresholds by Industry
Different industries have wildly different margin structures. Here's what you should typically aim for. For detailed benchmarks specific to your industry across all advertising platforms, see our Advertising Benchmarks.
E-commerce (physical products): 3.5-5x ROAS minimum. Most successful brands target 4-6x. High-ticket items with better margins can survive on 2.5-3x; low-margin products need 6-8x or higher.
Digital products and courses: 2-3x ROAS can work because margins are typically 70-90%. The lack of COGS and fulfillment costs changes everything. Some info product businesses profitably scale at 1.5-2x ROAS.
SaaS and subscription services: 1.5-3x ROAS on initial purchase, but lifetime value (LTV) matters more. A 2x ROAS might be incredibly profitable if customers stay for 24 months. More on this shortly.
Lead generation and services: 3-5x ROAS, but it depends entirely on close rates and average deal size. A $1,000 ad spend that generates 50 leads at a 10% close rate with $1,500 average sale value yields 5 sales and $7,500 revenue—a 7.5x ROAS.
Local businesses (restaurants, salons, gyms): 4-6x ROAS minimum. Lower margins and higher operational costs mean you need stronger returns. Many successful local campaigns run at 6-10x ROAS.
These are guidelines, not rules. Your specific numbers depend on your cost structure—which is why you need to calculate your own breakeven point rather than copying what works for others. Use our Break-Even ROAS Calculator to find your exact threshold based on your margins. If Meta's profitability thresholds don't align with your margins, compare performance and costs across platforms using our Platform Comparison Tool to find better alternatives.
The Metrics That Matter Beyond ROAS
ROAS is important. But it's not enough. Here are the metrics that separate profitable campaigns from money pits:
Customer Acquisition Cost (CAC): Total ad spend divided by number of customers acquired. If you spend $5,000 and acquire 100 customers, your CAC is $50. This needs to be significantly lower than your customer lifetime value.
Customer Lifetime Value (LTV): The total profit a customer generates over their entire relationship with your business. For subscription businesses, this is crucial. For e-commerce, repeat purchase rate determines this. The LTV:CAC ratio should be at least 3:1—preferably 4:1 or higher.
Contribution Margin Per Order: Revenue minus variable costs (COGS, shipping, processing, fulfillment). This tells you how much each sale actually contributes to covering your fixed costs and generating profit. Track this obsessively.
Blended ROAS vs. Platform ROAS: Meta's dashboard shows platform ROAS—revenue attributed to Meta ads divided by Meta ad spend. But customers often see multiple touchpoints before buying. Your blended ROAS (total revenue divided by total ad spend across all platforms) is usually lower but more accurate for profitability calculations.
Cost Per Purchase: Ad spend divided by number of purchases. This should trend downward as you optimize campaigns. If it's increasing while ROAS holds steady, your average order value is rising—potentially a good sign, but investigate why.
Break-Even Point in Units: How many sales do you need to cover your ad spend? If your contribution margin is $40 per sale and you spend $2,000 on ads, you need 50 sales to break even. Anything beyond that is profit.
Use our CPA Calculator to determine your cost per acquisition targets.
When "Successful" Campaigns Actually Lose Money
Three scenarios happen repeatedly:
Scenario 1: High ROAS, Low Margins
You're selling products with 15% profit margins and celebrating a 5x ROAS. But 1 ÷ 0.15 = 6.67x breakeven ROAS. You're losing money on every sale while your dashboard shows green.
The fix: Either increase prices, reduce costs, or accept that you need 7x+ ROAS to be profitable. Many businesses discover they're targeting the wrong products—the items that drive volume aren't the ones that drive profit.
Scenario 2: Ignoring Lifetime Value
You're spending $100 to acquire customers who make a $150 first purchase. Your product costs $75. After fulfillment and processing, you're left with $60 contribution margin. You're losing $40 per customer on the first sale.
But if 40% of customers make a second purchase within 90 days with a $50 contribution margin, your actual LTV is $80 ($60 + 40% × $50). Now you're profitable. But if you're only looking at first-purchase ROAS, you'd kill the campaign.
The fix: Track cohort performance over time. Calculate true LTV by analyzing repeat purchase rates, average order values on subsequent purchases, and customer retention. Then determine your acceptable CAC based on LTV, not just first purchase.
Scenario 3: Attribution Windows That Lie
Meta's default attribution window is 7-day click, 1-day view. But your customers might research for two weeks before buying. You're seeing a 3x ROAS in Meta's dashboard, but when you check your actual revenue against total ad spend, it's closer to 4.5x because of sales that happened outside the attribution window.
Or the opposite happens—Meta claims credit for sales that would've happened anyway or were actually driven by other channels. Your "5x ROAS" is really 3x when you account for organic traffic and branded search.
The fix: Use multiple attribution models. Compare Meta's reported ROAS against your actual revenue data in Google Analytics or your e-commerce platform. Track incrementality by running holdout tests where you pause ads for a segment of your audience and measure the revenue impact.
Related Tools: ROAS Calculator, CPA Calculator, Budget Allocator, Daily Budget Calculator.