Attribution Models for Multi-Platform Campaigns: Complete Comparison
Attribution determines how conversion credit is distributed across the multiple touchpoints in modern customer journeys. In an era where customers interact with brands across Meta, Google, TikTok, and other platforms before converting, attribution models fundamentally shape how you evaluate campaign performance, allocate budgets, and optimize strategies.
Yet attribution remains one of the most misunderstood and mismanaged aspects of digital advertising. Most advertisers rely on default platform attribution without understanding what it measures, how it differs across platforms, or which model best fits their business reality. This knowledge gap leads to budget misallocation, incorrect optimization decisions, and distorted ROAS calculations.
This comprehensive guide demystifies attribution models, compares platform-specific approaches, addresses multi-platform attribution challenges, and provides frameworks for choosing and implementing the right attribution strategy for your business.
Understanding Attribution in Multi-Platform Advertising
Attribution answers a deceptively simple question: Which advertising touchpoint deserves credit for this conversion?
In single-touchpoint journeys, attribution is straightforward. A user clicks your ad and immediately purchases. That ad receives 100% conversion credit. However, modern customer journeys rarely follow this simple path.
The Multi-Touch Attribution Challenge
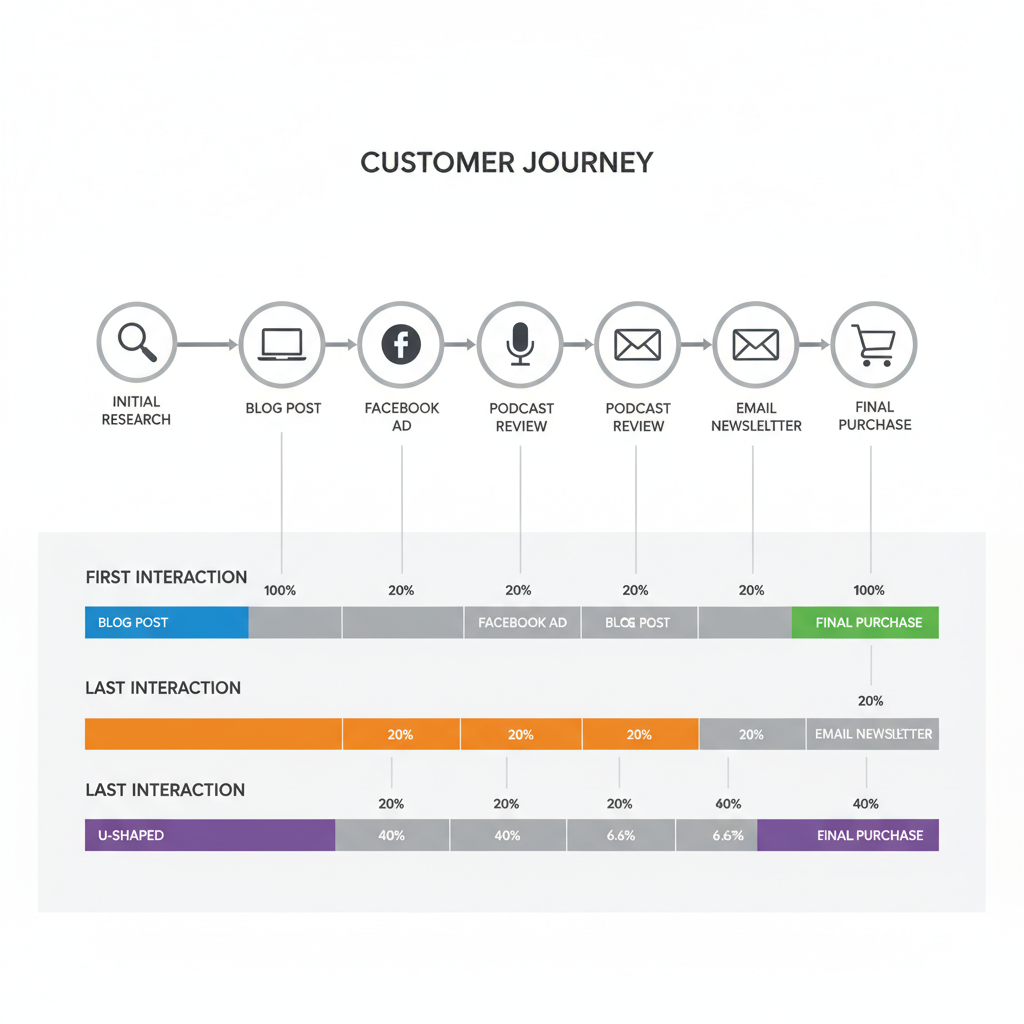
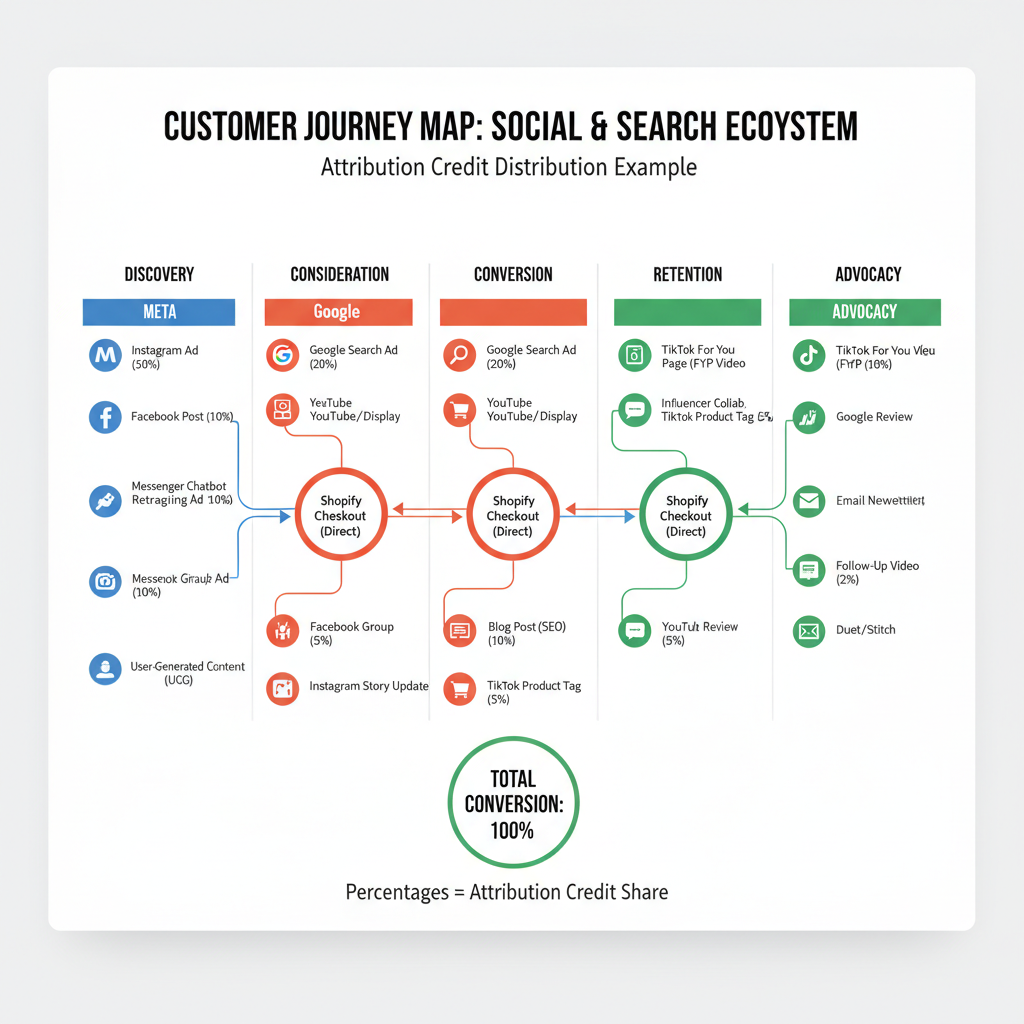
Consider a realistic ecommerce customer journey:
Day 1: User sees your Facebook awareness ad (impression, no click) Day 3: User clicks your Google Search ad, browses website, doesn't purchase Day 5: User clicks retargeting ad on Instagram, adds to cart, abandons checkout Day 7: User sees your YouTube ad (impression, no click) Day 10: User directly visits your website and completes purchaseWhich advertising touchpoint deserves credit for this conversion? The answer depends entirely on your attribution model:
- Last-click attribution: Direct traffic receives 100% credit (no ad credit)
- Last-click paid attribution: Instagram retargeting receives 100% credit
- First-click attribution: Google Search receives 100% credit
- Linear attribution: Credit splits equally across all touchpoints
- Time decay attribution: Recent touchpoints receive more credit
- Data-driven attribution: Machine learning determines credit distribution
Each model tells a different story about campaign performance, leading to dramatically different optimization decisions. Understanding these differences is essential for accurate performance evaluation.
Why Platform Attribution Differs
Each advertising platform reports conversions using its own attribution methodology, creating a fundamental challenge: the same conversion often receives credit from multiple platforms simultaneously.
Platform Self-Attribution Bias: Every platform wants to prove its value, leading to attribution methods that maximize reported conversions. Meta, Google, and TikTok often all claim credit for the same conversion. Different Attribution Windows: Platforms use different timeframes for attribution. A conversion might attribute to Meta (7-day click window) but not to Google (using 1-day click window), or vice versa. View-Through Attribution: Platforms differ in whether and how they credit impressions (not just clicks). Meta includes 1-day view-through attribution by default; Google makes it optional. Cross-Device Tracking: Platforms vary in their ability to track users across devices. A user clicking an ad on mobile but purchasing on desktop might attribute differently across platforms.These differences explain why your total platform-reported conversions typically exceed your actual conversion count by 30-70% in multi-platform environments. Understanding and reconciling these discrepancies is critical for accurate performance analysis.
Attribution Models Explained
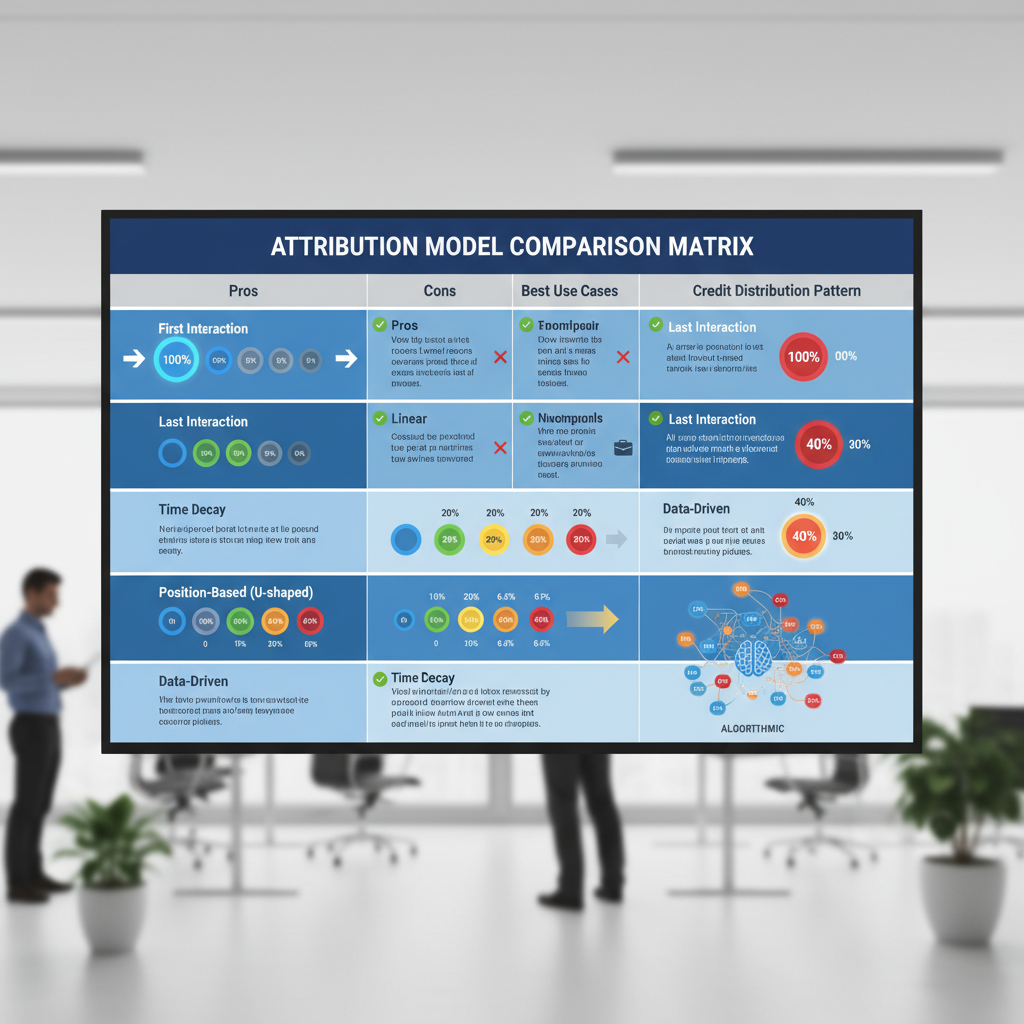
Seven primary attribution models dominate digital advertising, each with distinct credit distribution methodologies:
Last-Click Attribution
How it works: 100% of conversion credit goes to the last clicked ad before conversion. Impressions receive no credit. Non-ad traffic (direct, organic) can claim credit if it's the last touchpoint. Platform availability: Available across all platforms as "last-click" or "last-touch" attribution. Strengths:- Simple to understand and explain
- Emphasizes immediate conversion drivers
- Aligns with direct response marketing mental models
- Easy to optimize (clear cause-and-effect)
- Completely ignores awareness and consideration touchpoints
- Undervalues upper-funnel campaigns
- Incentivizes retargeting over prospecting
- Provides incomplete picture of customer journey
First-Click Attribution
How it works: 100% of conversion credit goes to the first clicked ad in the customer journey. All subsequent touchpoints receive zero credit. Platform availability: Available in Meta, Google Analytics, and third-party analytics platforms. Not available as a bidding optimization model. Strengths:- Values audience discovery and awareness campaigns
- Credits the touchpoint that initiated customer relationship
- Useful for understanding traffic sources
- Prevents retargeting from obscuring acquisition sources
- Ignores nurturing and conversion touchpoints
- Overvalues awareness campaigns that don't drive conversions
- Provides no credit to campaigns that close the sale
- Rare as sole attribution method in modern advertising
Linear Attribution
How it works: Conversion credit splits equally across all touchpoints in the customer journey. Every clicked ad receives the same credit regardless of position or timing. Platform availability: Google Analytics, Google Ads (as comparison model), third-party analytics. Not available for Meta or TikTok optimization. Strengths:- Credits all contributing touchpoints
- Doesn't bias toward any funnel stage
- Simple equal-weight approach
- Recognizes multi-touch journey reality
- Treats all touchpoints as equally important (rarely accurate)
- Doesn't reflect how customer journeys actually work
- Dilutes credit to genuinely impactful touchpoints
- Difficult to optimize against (unclear priorities)
Time Decay Attribution
How it works: Conversion credit increases for touchpoints closer to conversion. Early touchpoints receive minimal credit; touchpoints immediately before conversion receive maximum credit. Exact decay rate varies by implementation. Platform availability: Google Ads, Google Analytics, third-party platforms. Not available for Meta or TikTok optimization. Strengths:- Reflects intuitive logic (recent touches matter more)
- Values conversion-driving touchpoints
- Still credits earlier awareness touches
- More sophisticated than last-click while remaining understandable
- Arbitrary decay rate determines results significantly
- May undervalue crucial early touchpoints
- Assumes recency equals importance (not always true)
- Less common, reducing cross-platform comparability
Position-Based Attribution (U-Shaped)
How it works: 40% credit to first touch, 40% credit to last touch, 20% split among middle touchpoints. Also called U-shaped attribution for the credit distribution curve. Platform availability: Google Ads, Google Analytics, third-party platforms. Not standard in Meta or TikTok. Strengths:- Credits both discovery and conversion touchpoints
- Recognizes multi-touch journey reality
- More balanced than single-touch models
- Reflects common "awareness + conversion" campaign structures
- Arbitrary 40/40/20 split may not reflect your journey
- Middle touchpoints receive reduced credit
- More complex to explain and optimize
- Less widespread than other models
Data-Driven Attribution
How it works: Machine learning analyzes your conversion data to determine how much credit each touchpoint deserves based on actual statistical impact on conversion likelihood. Each touchpoint's credit varies based on observed conversion patterns. Platform availability: Google Ads (for accounts with sufficient data), Meta Advantage+ campaigns (implicit), Google Analytics 4. Strengths:- Based on your actual data, not arbitrary rules
- Adapts to your specific customer journeys
- Most accurate reflection of touchpoint value
- Continuously updates as patterns change
- Supported by platform algorithms for optimization
- Requires significant data volume (minimum thresholds)
- "Black box" methodology (unclear how credit is determined)
- Changes over time, complicating historical comparison
- Not available across all platforms consistently
- May not reflect strategic goals beyond conversion
Last-Click vs Data-Driven Attribution
The two most important attribution models in modern advertising are last-click (the traditional standard) and data-driven (the emerging standard). Understanding their differences shapes fundamental strategy decisions.
Why Platforms Push Data-Driven Attribution
Advertising platforms increasingly recommend or default to data-driven attribution for strategic reasons:
Algorithm Optimization: Data-driven attribution provides richer signal for machine learning optimization. Instead of binary conversion credit (0% or 100%), algorithms see contribution percentages across touchpoints. Upper-Funnel Value: Data-driven models credit awareness and consideration touchpoints that last-click ignores, encouraging broader campaign strategies that benefit platforms. Platform Performance: Data-driven attribution typically shows higher attributed conversion counts than last-click, making platform performance appear stronger. Competitive Pressure: As platforms compete for budget share, attribution methods that demonstrate value across the entire funnel strengthen their position.Google now defaults Google Ads accounts to data-driven attribution (when sufficient data exists). Meta's Advantage+ campaigns implicitly use data-driven optimization. The industry is moving decisively toward data-driven approaches.
Conversion Count Differences: Last-Click vs Data-Driven
Switching from last-click to data-driven attribution typically increases reported conversions by 15-30% for the same actual conversion volume:
Upper-Funnel Credit: Awareness and consideration campaigns that drove zero conversions in last-click models suddenly show contribution in data-driven models. Multi-Touch Splitting: Instead of one campaign receiving 100% credit, multiple campaigns share credit for each conversion. Total Credit Exceeds 100%: In data-driven models, a single conversion might distribute 1.3 credits across touchpoints (40% to Campaign A, 50% to Campaign B, 40% to Campaign C). ROAS Impact: The same campaign might show 1.5x ROAS in last-click attribution but 2.8x ROAS in data-driven attribution. Neither is "wrong"—they measure different things.When to Use Each Model
Use Last-Click Attribution When:- You're running single-touch, direct response campaigns only
- You need simple, transparent, easily explained attribution
- You're comparing performance across platforms lacking data-driven options
- You have limited conversion volume (under 300-400 monthly conversions)
- You want conservative attribution minimizing credit inflation
- You're running multi-touch campaigns across awareness, consideration, and conversion
- You have sufficient conversion volume for statistical significance
- You want platform algorithms to optimize using rich signal
- You're willing to accept algorithmic "black box" methodology
- You value comprehensive credit allocation over conservative reporting
Many sophisticated advertisers use both: data-driven for optimization and budget allocation, last-click for conservative reporting and cross-platform comparison.
Cross-Platform Attribution Challenges
Attribution complexity multiplies when customers interact with multiple advertising platforms before converting.
The Attribution Overlap Problem
In multi-platform environments, the sum of platform-reported conversions significantly exceeds actual conversions:
Example Scenario:- Actual conversions: 100
- Meta-reported conversions: 85 (85% attribution)
- Google-reported conversions: 75 (75% attribution)
- TikTok-reported conversions: 35 (35% attribution)
- Total platform-reported: 195 conversions (95% inflation)
This isn't platform error—it's attribution overlap. The same conversion receives credit from multiple platforms based on their respective attribution rules.
Why Attribution Overlap Occurs
Sequential Touchpoints: Users interact with multiple platforms before converting. A user might click a Meta ad, later click a Google ad, then convert. Both platforms claim credit based on their attribution windows. Different Attribution Windows: Meta's default 7-day click window might attribute a conversion that Google's 30-day click window also attributes, with TikTok's 7-day window potentially attributing the same conversion. View-Through Attribution: If one platform credits view-through (impressions) and another credits last-click, the same conversion attributes to both. Cross-Device Journeys: A user clicking an ad on mobile but converting on desktop creates attribution complexity as platforms track cross-device behavior differently.Managing Multi-Platform Attribution
Accept Overlap as Normal: Understand that platform-reported conversions will exceed actual conversions in multi-platform environments. This is expected, not a problem to "fix." Use Platform Metrics for Optimization: Optimize each platform based on its own attribution, even though totals inflate. Platform algorithms work best with platform-native metrics. Use Third-Party Analytics for Truth: Rely on Google Analytics or third-party attribution platforms for "source of truth" conversion counts and cross-platform journey analysis. Calculate Blended ROAS: Divide total actual revenue by total ad spend across all platforms for true ROAS calculation, accepting that platform-level ROAS will appear better than blended reality. Establish Attribution Hierarchy: For reporting purposes, establish which platform gets credit when multiple claim the same conversion (e.g., "last paid click wins").Platform-Specific Attribution Windows
Attribution windows define how long after an ad interaction platforms continue attributing conversions. These windows vary significantly across platforms and interaction types.
Meta Attribution Windows
Meta offers customizable attribution windows with these default settings:
Click Attribution Window:- Default: 7 days
- Options: 1 day or 7 days
- Meaning: Conversions occurring within 7 days of ad click receive attribution
- Default: 1 day
- Options: 1 day or none
- Meaning: Conversions occurring within 1 day of ad view (no click) receive attribution
Google Ads Attribution Windows
Google provides more attribution window flexibility:
Click Attribution Window:- Default: 30 days (Search, Shopping), 14 days (Display, YouTube)
- Options: 1, 7, 14, 30, 60, or 90 days
- Customizable per conversion action
- Default: Off for most campaign types
- Options: 1 day (Display, YouTube, Video action)
- Must be enabled explicitly
TikTok Attribution Windows
TikTok follows Meta's attribution approach with slight variations:
Click Attribution Window:- Default: 7 days
- Options: 1 or 7 days (limited compared to Google)
- Default: 1 day
- Options: 1 day or none
Comparing Attribution Windows Across Platforms
For consistent cross-platform comparison, align attribution windows:
Conservative Comparison: 1-day click, no view-through across all platforms. Most conservative attribution showing only immediate-response conversions. Standard Comparison: 7-day click, 1-day view across all platforms. Balances capturing multi-day consideration with reasonable attribution scope. Extended Comparison: 30-day click, 1-day view across all platforms. Credits longer consideration cycles but may over-attribute to older interactions.Remember that aligned attribution windows for comparison differ from optimized windows for each platform. Optimize with platform-recommended windows; align windows specifically for cross-platform performance comparison.
Choosing the Right Model for Your Business
Attribution model selection should reflect your business reality, not platform defaults:
Business Model Considerations
Ecommerce with Impulse Purchases: Products under $50 with immediate purchase patterns perform well with last-click attribution. Customers research minimally, so first touch and last touch are often identical. Ecommerce with Considered Purchases: Higher-value products ($500+) or complex purchases (mattresses, furniture) benefit from multi-touch attribution crediting awareness campaigns that initiate research. Lead Generation (B2B): Long sales cycles with extensive research require position-based or data-driven attribution. First touch identifies traffic sources; last touch identifies conversion drivers. Subscription/SaaS: Free trial or freemium models need multi-touch attribution across trial signup (micro-conversion) and paid conversion (macro-conversion). Local Businesses: Businesses with primarily local, mobile-driven traffic perform well with shorter attribution windows (1-3 days) and last-click models reflecting immediate intent.Purchase Cycle Considerations
Purchase Cycle Length dramatically affects appropriate attribution: Same-Day Purchases: Last-click attribution accurately reflects single-session purchase behavior. Additional attribution complexity provides minimal value. 2-7 Day Cycles: Standard attribution windows (7-day click) capture most conversion activity. Linear or time-decay models credit multi-day consideration. 7-30 Day Cycles: Extended attribution windows (14-30 day click) prevent under-attribution. Position-based models credit both discovery and conversion touchpoints. 30+ Day Cycles: Maximum attribution windows (60-90 day click for Google) and data-driven models capture long research periods. Consider customer-reported attribution surveys for extremely long cycles.Campaign Structure Considerations
Single Campaign Type: If you're only running retargeting or only running prospecting, last-click attribution works well. Attribution complexity matters most when mixing campaign types. Integrated Multi-Funnel: When running awareness + consideration + conversion campaigns, multi-touch attribution (preferably data-driven) prevents over-optimizing for retargeting while under-investing in prospecting. Multi-Platform Campaigns: Cross-platform strategies require third-party attribution platforms or acceptance that platform-native attribution will show overlapping credit. Testing Emphasis: Heavy A/B testing benefits from consistent, simple attribution (last-click) that doesn't change methodology during test periods.Setting Up Multi-Touch Attribution
Implementing sophisticated attribution requires tools beyond platform-native options:
Google Analytics 4 Attribution
GA4 provides the most accessible multi-touch attribution for most businesses:
Setup: Install GA4 tracking across your website. Enable ecommerce tracking for revenue attribution. Link GA4 to Google Ads and import conversions. Attribution Reports: Access Attribution → Model Comparison to compare last-click, first-click, linear, time-decay, position-based, and data-driven models using the same data. Custom Attribution: Create custom attribution models with specified touchpoint weights using GA4's attribution interface. Limitations: GA4 attribution only covers traffic visible to Google Analytics. Won't capture view-through impressions from Meta or TikTok without additional implementation.Third-Party Attribution Platforms
Enterprise advertisers often use dedicated attribution platforms:
TripleWhale: Ecommerce-focused attribution providing source of truth for Shopify stores. Integrates Meta, Google, TikTok, and other platforms into unified attribution. Northbeam: Advanced multi-touch attribution with person-level tracking across channels. Premium pricing for sophisticated advertisers. Rockerbox: Marketing attribution platform connecting advertising spend to revenue across all channels and touchpoints. Hyros: Focused on tracking customer journey accuracy, particularly valuable for information product and coaching businesses. Wicked Reports: Multi-touch attribution specialized for subscription and recurring revenue businesses.These platforms provide unified attribution dashboards showing customer journeys across all platforms, but come with significant costs ($500-$5000+ monthly).
Server-Side Tracking for Attribution
Server-side tracking improves attribution accuracy:
Implementation: Send conversion events from your server to advertising platforms using Conversion APIs (Meta), Enhanced Conversions (Google), and Events API (TikTok). Benefits: Captures conversions that browser-based pixels miss due to ad blockers, privacy settings, or iOS limitations. Improves attribution accuracy by 15-30%. Cross-Platform Matching: Server-side tracking enables better cross-device and cross-platform matching using email addresses and other identifiers. Setup: Use platform integrations (Shopify apps), Google Tag Manager Server-Side, or custom API implementations.Proper conversion tracking setup is prerequisite for any attribution model. Attribution accuracy depends entirely on tracking data quality.
Interpreting Multi-Platform Attribution Data
Successfully using attribution data requires understanding what different reports actually mean:
Platform Attribution Reports
Each platform's attribution report shows conversion credit from that platform's perspective:
Meta Attribution: Meta reports conversions where users clicked or viewed Meta ads within the attribution window before converting. These conversions may also attribute to other platforms. Google Attribution: Google reports conversions where users clicked Google ads within attribution windows before converting. These typically overlap significantly with Meta attributions. TikTok Attribution: TikTok reports conversions where users interacted with TikTok ads before converting. Expect overlap with Meta and Google. Key Understanding: Platform reports answer "How many conversions involved this platform?" not "How many conversions came exclusively from this platform?"Third-Party Attribution Reports
Google Analytics and third-party platforms attempt to answer which platform "really" drove the conversion:
Source/Medium Reports: Show the last non-direct traffic source before conversion. Useful for understanding final touchpoint but ignores earlier interactions. Multi-Channel Funnel Reports: Show conversion paths across multiple channels. Reveals how platforms work together in customer journeys. Model Comparison: Shows how conversion credit differs across attribution models (last-click vs first-click vs data-driven). Key Understanding: Third-party reports use different tracking than ad platforms, so conversion counts often differ from platform reports.Reconciling Different Attribution Views
Establish Primary Metrics: Choose one attribution view as your "source of truth" for reporting. Common choices: Google Analytics last-click, platform-native data-driven, or blended ROAS calculation. Use Platform Data for Optimization: Optimize campaigns using platform-native attribution even if it differs from your reporting truth. Platform algorithms work best with platform data. Calculate Blended ROAS: Total revenue divided by total ad spend provides platform-agnostic efficiency metric complementing platform-specific ROAS. Understand Overlap: Accept that platform-reported conversions sum to more than actual conversions. This overlap is normal and expected in multi-platform environments. Monitor Trends Over Time: Absolute attribution numbers matter less than directional trends. Focus on whether attribution is improving or declining regardless of which model you use.Building Your Attribution Strategy
Implement attribution systematically rather than accepting platform defaults:
Step 1: Document Current State
Inventory Current Attribution: Document which attribution model and windows each platform currently uses. Note whether settings are defaults or custom configurations. Measure Attribution Overlap: Compare total platform-reported conversions against actual conversions to quantify overlap percentage. Identify Attribution Gaps: Determine which touchpoints receive zero credit in current attribution (e.g., awareness campaigns in last-click models).Step 2: Define Attribution Goals
Strategic Priorities: Decide whether you prioritize conservative reporting (last-click), comprehensive credit (multi-touch), or algorithmic optimization (data-driven). Reporting Needs: Consider stakeholder expectations and reporting requirements. Some organizations require transparent, explainable attribution (ruling out data-driven black boxes). Optimization Approach: Determine whether you'll optimize using platform-native attribution or unified third-party attribution.Step 3: Select Attribution Approach
For Small Budgets (<$5k/month): Use last-click attribution across all platforms with aligned attribution windows (7-day click, 1-day view). Simplicity and comparability matter more than sophisticated attribution. For Medium Budgets ($5k-$50k/month): Use platform-recommended attribution (data-driven where available) for optimization, Google Analytics for cross-platform reporting truth. For Large Budgets ($50k+/month): Consider third-party attribution platforms providing unified view across channels. Use data-driven attribution within each platform for optimization.Step 4: Implement and Monitor
Configure Attribution Settings: Update attribution windows and models across platforms based on your selected approach. Baseline Performance: Measure performance immediately after attribution changes to establish new baselines. Compare Models: Use Google Analytics model comparison or platform attribution reports to understand how different models credit your campaigns. Adjust Strategy: Refine attribution approach based on actual performance and insights gained from attribution analysis.Conclusion: Building Your Attribution Strategy
Attribution is not a technical setting but a strategic framework shaping how you understand campaign performance and allocate resources. The "right" attribution model depends on your business reality—purchase cycle length, campaign complexity, budget size, and strategic priorities.
The advertising industry is moving decisively toward data-driven attribution as platforms invest in machine learning optimization requiring rich signal across touchpoints. However, data-driven models aren't universally superior. Businesses with limited conversion volume, simple campaign structures, or preferences for transparent methodology may achieve better results with traditional attribution approaches.
Most importantly, attribution consistency matters more than attribution sophistication. Changing attribution models makes historical comparisons meaningless. Select an attribution approach aligned with your business needs, implement it consistently, and evaluate performance using that consistent framework over time.
For multi-platform campaigns, accept that attribution overlap is normal and unavoidable. Platform-reported conversions will exceed actual conversions by 30-70% in typical multi-platform environments. This doesn't represent error—it represents the reality that most conversions involve multiple platform touchpoints.
Use platform-native attribution for campaign optimization within each platform. Use third-party analytics (Google Analytics 4 or dedicated attribution platforms) for cross-platform source of truth. Calculate blended ROAS (total revenue / total spend) as the ultimate efficiency metric transcending attribution complexity.
Combine proper attribution with robust conversion tracking and thoughtful UTM parameter implementation to build comprehensive performance measurement infrastructure. Monitor your ROAS with confidence knowing your attribution strategy accurately reflects your business reality rather than platform defaults.
Attribution will never be perfect. Customer journeys are complex, multi-platform, cross-device, and increasingly privacy-protected. But understanding attribution models, implementing strategic choices, and interpreting data within attribution context transforms attribution from a confusing limitation into a strategic advantage informing smarter optimization decisions.